Okinawan vs Immigrants from Laos Ambulatory Disability
COMPARE
Okinawan
Immigrants from Laos
Ambulatory Disability
Ambulatory Disability Comparison
Okinawans
Immigrants from Laos
5.3%
AMBULATORY DISABILITY
100.0/ 100
METRIC RATING
12th/ 347
METRIC RANK
6.3%
AMBULATORY DISABILITY
13.2/ 100
METRIC RATING
210th/ 347
METRIC RANK
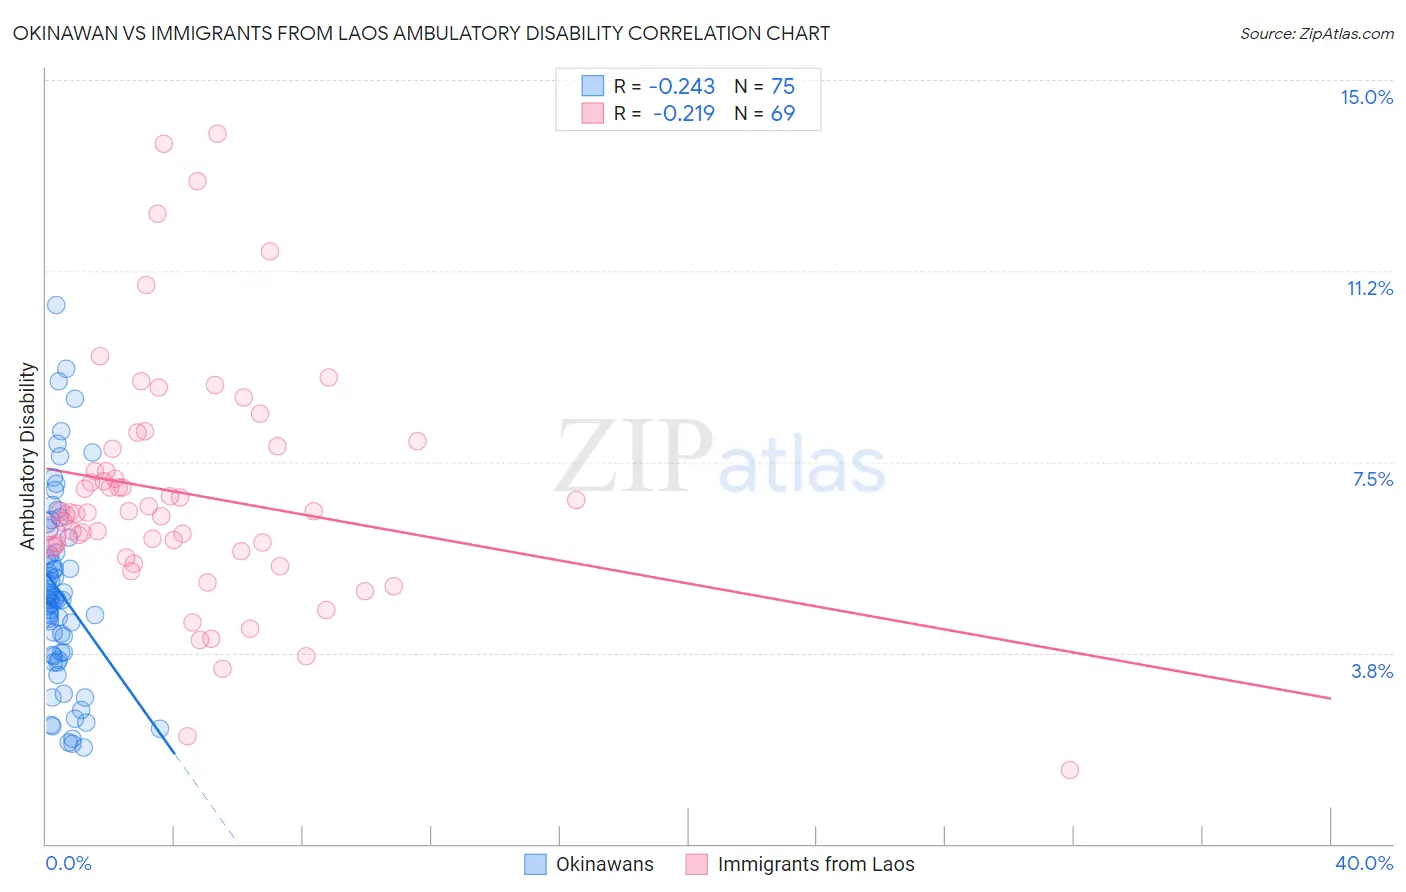
Okinawan vs Immigrants from Laos Ambulatory Disability Correlation Chart
The statistical analysis conducted on geographies consisting of 73,734,691 people shows a weak negative correlation between the proportion of Okinawans and percentage of population with ambulatory disability in the United States with a correlation coefficient (R) of -0.243 and weighted average of 5.3%. Similarly, the statistical analysis conducted on geographies consisting of 201,465,206 people shows a weak negative correlation between the proportion of Immigrants from Laos and percentage of population with ambulatory disability in the United States with a correlation coefficient (R) of -0.219 and weighted average of 6.3%, a difference of 19.3%.
Ambulatory Disability Correlation Summary
| Measurement | Okinawan | Immigrants from Laos |
| Minimum | 1.9% | 1.4% |
| Maximum | 10.6% | 13.9% |
| Range | 8.7% | 12.5% |
| Mean | 4.9% | 6.9% |
| Median | 4.8% | 6.5% |
| Interquartile 25% (IQ1) | 3.7% | 5.8% |
| Interquartile 75% (IQ3) | 5.7% | 7.8% |
| Interquartile Range (IQR) | 2.0% | 2.0% |
| Standard Deviation (Sample) | 1.8% | 2.4% |
| Standard Deviation (Population) | 1.8% | 2.4% |
Similar Demographics by Ambulatory Disability
Demographics Similar to Okinawans by Ambulatory Disability
In terms of ambulatory disability, the demographic groups most similar to Okinawans are Immigrants from Korea (5.2%, a difference of 0.31%), Burmese (5.3%, a difference of 0.50%), Immigrants from Eastern Asia (5.3%, a difference of 0.65%), Immigrants from China (5.3%, a difference of 0.98%), and Immigrants from Hong Kong (5.3%, a difference of 1.5%).
| Demographics | Rating | Rank | Ambulatory Disability |
| Immigrants | Singapore | 100.0 /100 | #5 | Exceptional 5.0% |
| Immigrants | Bolivia | 100.0 /100 | #6 | Exceptional 5.0% |
| Bolivians | 100.0 /100 | #7 | Exceptional 5.1% |
| Immigrants | South Central Asia | 100.0 /100 | #8 | Exceptional 5.1% |
| Iranians | 100.0 /100 | #9 | Exceptional 5.1% |
| Yup'ik | 100.0 /100 | #10 | Exceptional 5.2% |
| Immigrants | Korea | 100.0 /100 | #11 | Exceptional 5.2% |
| Okinawans | 100.0 /100 | #12 | Exceptional 5.3% |
| Burmese | 100.0 /100 | #13 | Exceptional 5.3% |
| Immigrants | Eastern Asia | 100.0 /100 | #14 | Exceptional 5.3% |
| Immigrants | China | 100.0 /100 | #15 | Exceptional 5.3% |
| Immigrants | Hong Kong | 100.0 /100 | #16 | Exceptional 5.3% |
| Immigrants | Ethiopia | 100.0 /100 | #17 | Exceptional 5.4% |
| Immigrants | Sri Lanka | 100.0 /100 | #18 | Exceptional 5.4% |
| Indians (Asian) | 100.0 /100 | #19 | Exceptional 5.4% |
Demographics Similar to Immigrants from Laos by Ambulatory Disability
In terms of ambulatory disability, the demographic groups most similar to Immigrants from Laos are Immigrants from Iraq (6.3%, a difference of 0.080%), Bangladeshi (6.3%, a difference of 0.10%), Samoan (6.3%, a difference of 0.14%), Mexican American Indian (6.3%, a difference of 0.15%), and Japanese (6.3%, a difference of 0.15%).
| Demographics | Rating | Rank | Ambulatory Disability |
| Immigrants | Ukraine | 18.4 /100 | #203 | Poor 6.2% |
| Immigrants | Congo | 18.2 /100 | #204 | Poor 6.2% |
| Slovenes | 18.0 /100 | #205 | Poor 6.2% |
| Finns | 17.2 /100 | #206 | Poor 6.2% |
| Alsatians | 15.1 /100 | #207 | Poor 6.3% |
| Bangladeshis | 14.2 /100 | #208 | Poor 6.3% |
| Immigrants | Iraq | 14.0 /100 | #209 | Poor 6.3% |
| Immigrants | Laos | 13.2 /100 | #210 | Poor 6.3% |
| Samoans | 12.1 /100 | #211 | Poor 6.3% |
| Mexican American Indians | 12.0 /100 | #212 | Poor 6.3% |
| Japanese | 12.0 /100 | #213 | Poor 6.3% |
| Immigrants | Mexico | 11.0 /100 | #214 | Poor 6.3% |
| Immigrants | Latin America | 11.0 /100 | #215 | Poor 6.3% |
| Canadians | 10.9 /100 | #216 | Poor 6.3% |
| Yugoslavians | 10.9 /100 | #217 | Poor 6.3% |