Romanian vs Immigrants from Scotland Ambulatory Disability

COMPARE

Romanian
Race
Ancestry
AfghanAfricanAlaska NativeAlaskan AthabascanAlbanianAleutAlsatianAmericanApacheArabArapahoArgentineanArmenianAssyrian/Chaldean/SyriacAustralianAustrianBahamianBangladeshiBarbadianBasqueBelgianBelizeanBermudanBhutaneseBlackfeetBolivianBrazilianBritishBritish West IndianBulgarianBurmeseCajunCambodianCanadianCape VerdeanCarpatho RusynCelticCentral AmericanCentral American IndianCherokeeCheyenneChickasawChileanChineseChippewaChoctawColombianColvilleComancheCosta RicanCreeCreekCroatianCrowCubanCypriotCzechCzechoslovakianDanishDelawareDominicanDutchDutch West IndianEastern EuropeanEcuadorianEgyptianEnglishEstonianEthiopianEuropeanFijianFilipinoFinnishFrenchFrench American IndianFrench CanadianGermanGerman RussianGhanaianGreekGuamanian/ChamorroGuatemalanGuyaneseHaitianHmongHonduranHopiHoumaHungarianIcelanderIndian (Asian)IndonesianInupiatIranianIraqiIrishIroquoisIsraeliItalianJamaicanJapaneseJordanianKenyanKiowaKoreanLaotianLatvianLebaneseLiberianLithuanianLumbeeLuxembourgerMacedonianMalaysianMalteseMarshalleseMenomineeMexicanMexican American IndianMongolianMoroccanNative HawaiianNavajoNepaleseNew ZealanderNicaraguanNigerianNorthern EuropeanNorwegianOkinawanOsageOttawaPaiutePakistaniPalestinianPanamanianParaguayanPennsylvania GermanPeruvianPimaPolishPortuguesePotawatomiPuebloPuerto RicanPuget Sound SalishRomanianRussianSalvadoranSamoanScandinavianScotch-IrishScottishSeminoleSenegaleseSerbianShoshoneSierra LeoneanSiouxSlavicSlovakSloveneSomaliSouth AfricanSouth AmericanSouth American IndianSoviet UnionSpaniardSpanishSpanish AmericanSpanish American IndianSri LankanSubsaharan AfricanSudaneseSwedishSwissSyrianTaiwaneseThaiTlingit-HaidaTohono O'OdhamTonganTrinidadian and TobagonianTsimshianTurkishU.S. Virgin IslanderUgandanUkrainianUruguayanUteVenezuelanVietnameseWelshWest IndianYakamaYaquiYugoslavianYumanYup'ikZimbabwean
Immigration
NonimmigrantsImmigrantsAfghanistanAfricaAlbaniaArgentinaArmeniaAsiaAustraliaAustriaBahamasBangladeshBarbadosBelarusBelgiumBelizeBoliviaBosnia and HerzegovinaBrazilBulgariaBurma/MyanmarCabo VerdeCambodiaCameroonCanadaCaribbeanCentral AmericaChileChinaColombiaCongoCosta RicaCroatiaCubaCzechoslovakiaDenmarkDominicaDominican RepublicEastern AfricaEastern AsiaEastern EuropeEcuadorEgyptEl SalvadorEnglandEritreaEthiopiaEuropeFijiFranceGermanyGhanaGreeceGrenadaGuatemalaGuyanaHaitiHondurasHong KongHungaryIndiaIndonesiaIranIraqIrelandIsraelItalyJamaicaJapanJordanKazakhstanKenyaKoreaKuwaitLaosLatin AmericaLatviaLebanonLiberiaLithuaniaMalaysiaMexicoMicronesiaMiddle AfricaMoldovaMoroccoNepalNetherlandsNicaraguaNigeriaNorth AmericaNorth MacedoniaNorthern AfricaNorthern EuropeNorwayOceaniaPakistanPanamaPeruPhilippinesPolandPortugalRomaniaRussiaSaudi ArabiaSenegalSerbiaSierra LeoneSingaporeSomaliaSouth AfricaSouth AmericaSouth Central AsiaSouth Eastern AsiaSouthern EuropeSpainSri LankaSt. Vincent and the GrenadinesSudanSwedenSwitzerlandSyriaTaiwanThailandTrinidad and TobagoTurkeyUgandaUkraineUruguayUzbekistanVenezuelaVietnamWest IndiesWestern AfricaWestern AsiaWestern EuropeYemenZaireZimbabweAzores
Immigrants from Scotland
Race
Ancestry
AfghanAfricanAlaska NativeAlaskan AthabascanAlbanianAleutAlsatianAmericanApacheArabArapahoArgentineanArmenianAssyrian/Chaldean/SyriacAustralianAustrianBahamianBangladeshiBarbadianBasqueBelgianBelizeanBermudanBhutaneseBlackfeetBolivianBrazilianBritishBritish West IndianBulgarianBurmeseCajunCambodianCanadianCape VerdeanCarpatho RusynCelticCentral AmericanCentral American IndianCherokeeCheyenneChickasawChileanChineseChippewaChoctawColombianColvilleComancheCosta RicanCreeCreekCroatianCrowCubanCypriotCzechCzechoslovakianDanishDelawareDominicanDutchDutch West IndianEastern EuropeanEcuadorianEgyptianEnglishEstonianEthiopianEuropeanFijianFilipinoFinnishFrenchFrench American IndianFrench CanadianGermanGerman RussianGhanaianGreekGuamanian/ChamorroGuatemalanGuyaneseHaitianHmongHonduranHopiHoumaHungarianIcelanderIndian (Asian)IndonesianInupiatIranianIraqiIrishIroquoisIsraeliItalianJamaicanJapaneseJordanianKenyanKiowaKoreanLaotianLatvianLebaneseLiberianLithuanianLumbeeLuxembourgerMacedonianMalaysianMalteseMarshalleseMenomineeMexicanMexican American IndianMongolianMoroccanNative HawaiianNavajoNepaleseNew ZealanderNicaraguanNigerianNorthern EuropeanNorwegianOkinawanOsageOttawaPaiutePakistaniPalestinianPanamanianParaguayanPennsylvania GermanPeruvianPimaPolishPortuguesePotawatomiPuebloPuerto RicanPuget Sound SalishRussianSalvadoranSamoanScandinavianScotch-IrishScottishSeminoleSenegaleseSerbianShoshoneSierra LeoneanSiouxSlavicSlovakSloveneSomaliSouth AfricanSouth AmericanSouth American IndianSoviet UnionSpaniardSpanishSpanish AmericanSpanish American IndianSri LankanSubsaharan AfricanSudaneseSwedishSwissSyrianTaiwaneseThaiTlingit-HaidaTohono O'OdhamTonganTrinidadian and TobagonianTsimshianTurkishU.S. Virgin IslanderUgandanUkrainianUruguayanUteVenezuelanVietnameseWelshWest IndianYakamaYaquiYugoslavianYumanYup'ikZimbabwean
Immigration
NonimmigrantsImmigrantsAfghanistanAfricaAlbaniaArgentinaArmeniaAsiaAustraliaAustriaBahamasBangladeshBarbadosBelarusBelgiumBelizeBoliviaBosnia and HerzegovinaBrazilBulgariaBurma/MyanmarCabo VerdeCambodiaCameroonCanadaCaribbeanCentral AmericaChileChinaColombiaCongoCosta RicaCroatiaCubaCzechoslovakiaDenmarkDominicaDominican RepublicEastern AfricaEastern AsiaEastern EuropeEcuadorEgyptEl SalvadorEnglandEritreaEthiopiaEuropeFijiFranceGermanyGhanaGreeceGrenadaGuatemalaGuyanaHaitiHondurasHong KongHungaryIndiaIndonesiaIranIraqIrelandIsraelItalyJamaicaJapanJordanKazakhstanKenyaKoreaKuwaitLaosLatin AmericaLatviaLebanonLiberiaLithuaniaMalaysiaMexicoMicronesiaMiddle AfricaMoldovaMoroccoNepalNetherlandsNicaraguaNigeriaNorth AmericaNorth MacedoniaNorthern AfricaNorthern EuropeNorwayOceaniaPakistanPanamaPeruPhilippinesPolandPortugalRomaniaRussiaSaudi ArabiaScotlandSenegalSerbiaSierra LeoneSingaporeSomaliaSouth AfricaSouth AmericaSouth Central AsiaSouth Eastern AsiaSouthern EuropeSpainSri LankaSt. Vincent and the GrenadinesSudanSwedenSwitzerlandSyriaTaiwanThailandTrinidad and TobagoTurkeyUgandaUkraineUruguayUzbekistanVenezuelaVietnamWest IndiesWestern AfricaWestern AsiaWestern EuropeYemenZaireZimbabweAzores
Ambulatory Disability
Income
Poverty
Unemployment
Labor Participation
Family Structure
Vehicle Availability
Education Level
Disability

Ambulatory Disability Comparison

Romanians

Immigrants from Scotland

Excellent
Good
6.0%
AMBULATORY DISABILITY
82.9/ 100
METRIC RATING
143rd/ 347
METRIC RANK
6.0%
AMBULATORY DISABILITY
72.1/ 100
METRIC RATING
155th/ 347
METRIC RANK

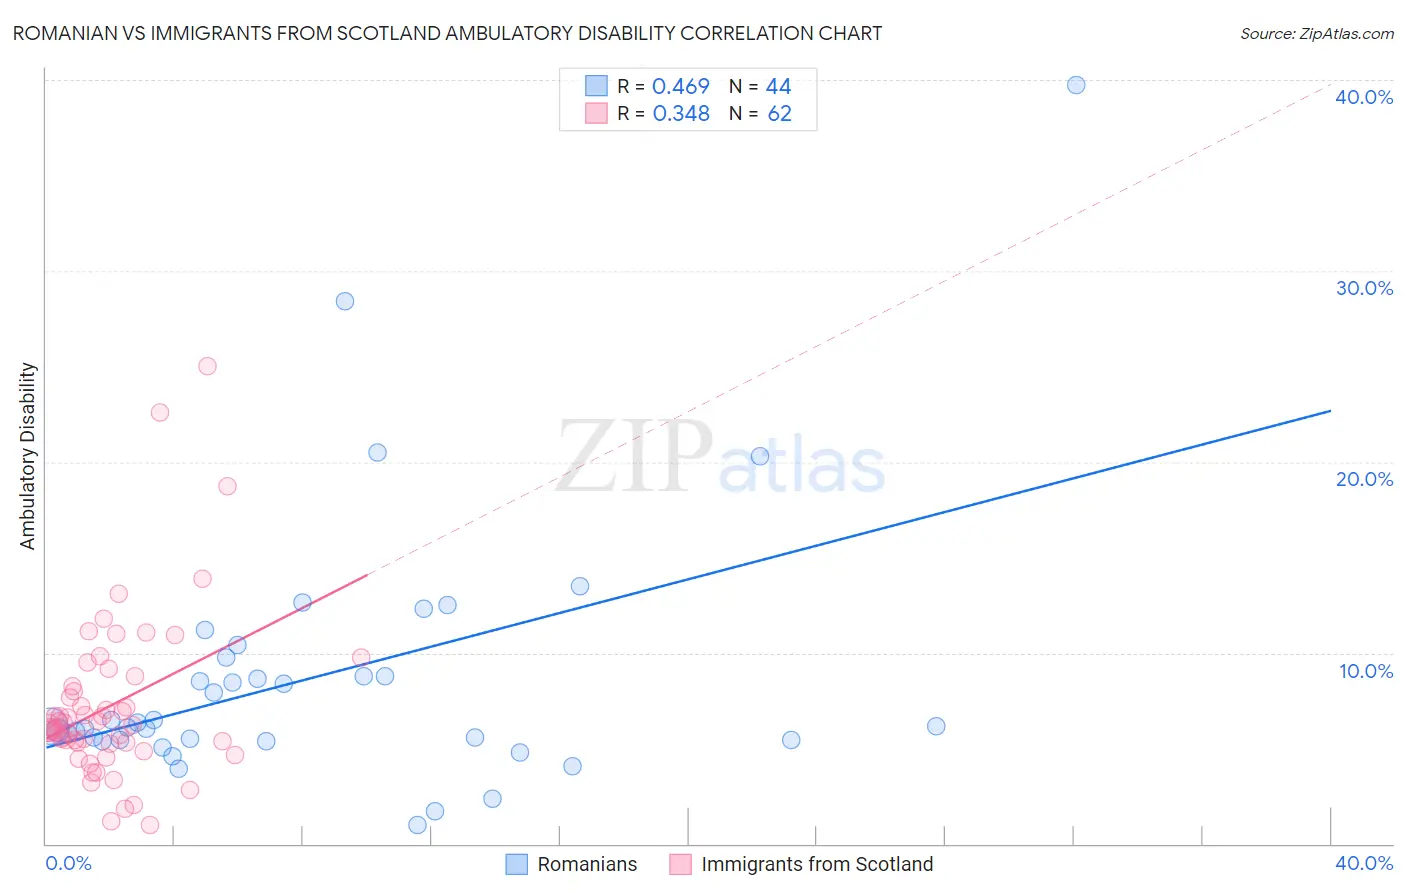
Romanian vs Immigrants from Scotland Ambulatory Disability Correlation Chart

The statistical analysis conducted on geographies consisting of 377,793,215 people shows a moderate positive correlation between the proportion of Romanians and percentage of population with ambulatory disability in the United States with a correlation coefficient (R) of 0.469 and weighted average of 6.0%. Similarly, the statistical analysis conducted on geographies consisting of 196,384,965 people shows a mild positive correlation between the proportion of Immigrants from Scotland and percentage of population with ambulatory disability in the United States with a correlation coefficient (R) of 0.348 and weighted average of 6.0%, a difference of 0.85%.
Romanian vs Immigrants from Scotland Ambulatory Disability

Ambulatory Disability Correlation Summary

MeasurementRomanianImmigrants from Scotland
Minimum1.00%0.96%
Maximum39.7%25.0%
Range38.7%24.0%
Mean8.7%7.2%
Median6.2%6.2%
Interquartile 25% (IQ1)5.4%5.3%
Interquartile 75% (IQ3)9.3%8.2%
Interquartile Range (IQR)3.8%3.0%
Standard Deviation (Sample)7.0%4.4%
Standard Deviation (Population)6.9%4.3%

Demographics Similar to Romanians and Immigrants from Scotland by Ambulatory Disability

In terms of ambulatory disability, the demographic groups most similar to Romanians are Immigrants from Philippines (6.0%, a difference of 0.010%), Macedonian (6.0%, a difference of 0.010%), Swedish (6.0%, a difference of 0.020%), Czech (6.0%, a difference of 0.040%), and Pakistani (6.0%, a difference of 0.040%). Similarly, the demographic groups most similar to Immigrants from Scotland are Northern European (6.0%, a difference of 0.020%), Ghanaian (6.0%, a difference of 0.050%), Immigrants from Fiji (6.0%, a difference of 0.070%), Immigrants from Latvia (6.0%, a difference of 0.070%), and Immigrants from Croatia (6.0%, a difference of 0.21%).
DemographicsRating | RankAmbulatory Disability
Immigrants | Zaire
83.6
/100
|
#139
Excellent
6.0%
Czechs
83.3
/100
|
#140
Excellent
6.0%
Swedes
83.1
/100
|
#141
Excellent
6.0%
Immigrants | Philippines
83.0
/100
|
#142
Excellent
6.0%
Romanians
82.9
/100
|
#143
Excellent
6.0%
Macedonians
82.8
/100
|
#144
Excellent
6.0%
Pakistanis
82.5
/100
|
#145
Excellent
6.0%
Immigrants | Greece
82.5
/100
|
#146
Excellent
6.0%
Immigrants | Moldova
82.4
/100
|
#147
Excellent
6.0%
Immigrants | Eastern Europe
82.0
/100
|
#148
Excellent
6.0%
Lithuanians
81.9
/100
|
#149
Excellent
6.0%
Maltese
81.6
/100
|
#150
Excellent
6.0%
Greeks
79.6
/100
|
#151
Good
6.0%
Immigrants | Austria
78.8
/100
|
#152
Good
6.0%
Syrians
75.5
/100
|
#153
Good
6.0%
Immigrants | Croatia
75.1
/100
|
#154
Good
6.0%
Immigrants | Scotland
72.1
/100
|
#155
Good
6.0%
Northern Europeans
71.8
/100
|
#156
Good
6.0%
Ghanaians
71.3
/100
|
#157
Good
6.0%
Immigrants | Fiji
71.2
/100
|
#158
Good
6.0%
Immigrants | Latvia
71.1
/100
|
#159
Good
6.0%