Romanian vs Immigrants from Laos Householder Income Over 65 years
COMPARE
Romanian
Immigrants from Laos
Householder Income Over 65 years
Householder Income Over 65 years Comparison
Romanians
Immigrants from Laos
$64,142
HOUSEHOLDER INCOME OVER 65 YEARS
96.5/ 100
METRIC RATING
98th/ 347
METRIC RANK
$56,722
HOUSEHOLDER INCOME OVER 65 YEARS
1.2/ 100
METRIC RATING
239th/ 347
METRIC RANK
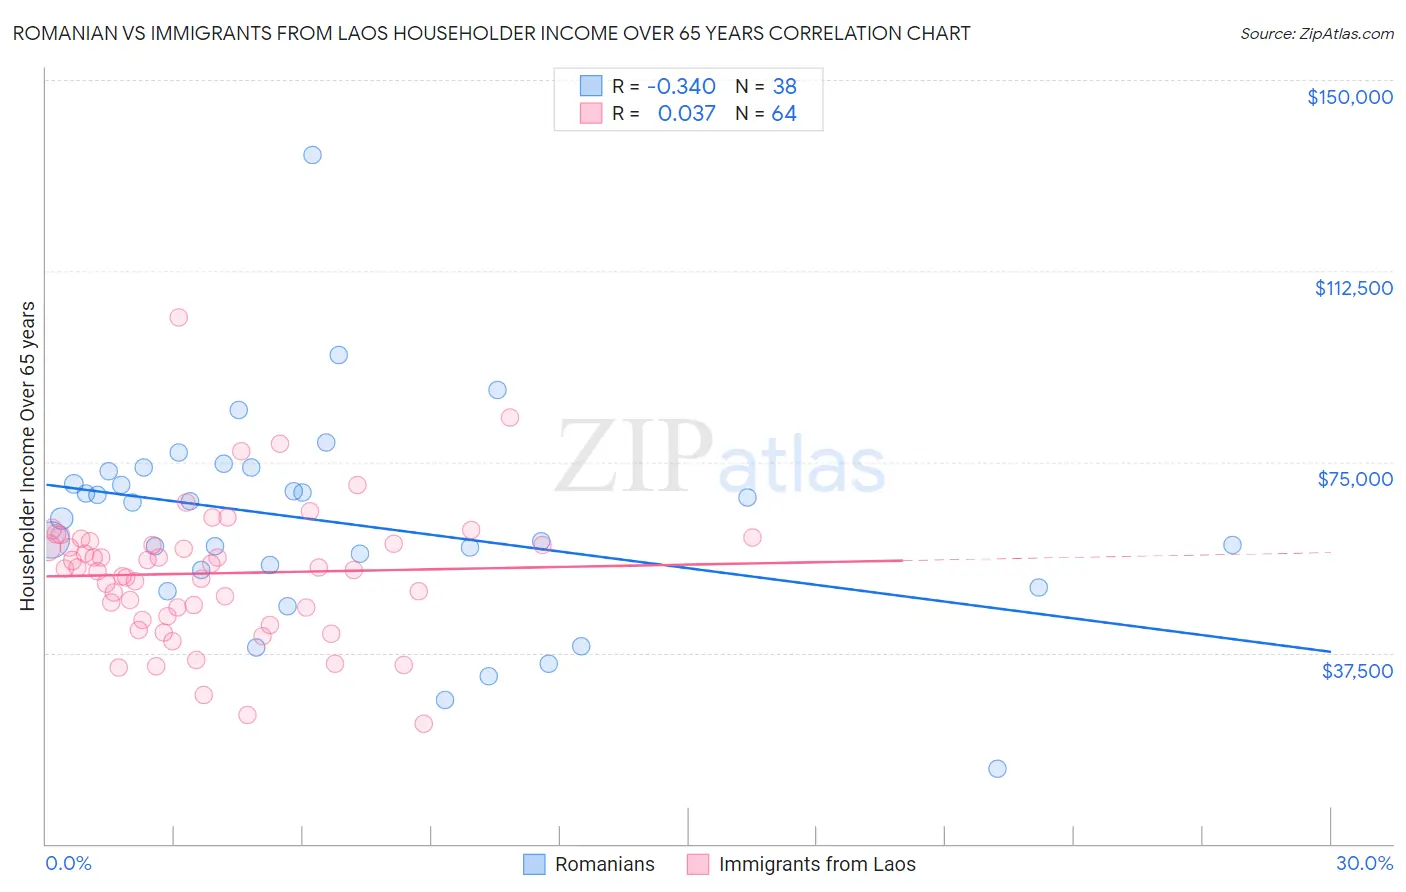
Romanian vs Immigrants from Laos Householder Income Over 65 years Correlation Chart
The statistical analysis conducted on geographies consisting of 376,856,051 people shows a mild negative correlation between the proportion of Romanians and household income with householder over the age of 65 in the United States with a correlation coefficient (R) of -0.340 and weighted average of $64,142. Similarly, the statistical analysis conducted on geographies consisting of 201,251,653 people shows no correlation between the proportion of Immigrants from Laos and household income with householder over the age of 65 in the United States with a correlation coefficient (R) of 0.037 and weighted average of $56,722, a difference of 13.1%.
Householder Income Over 65 years Correlation Summary
| Measurement | Romanian | Immigrants from Laos |
| Minimum | $14,625 | $23,566 |
| Maximum | $135,238 | $103,242 |
| Range | $120,613 | $79,676 |
| Mean | $62,942 | $53,102 |
| Median | $65,425 | $54,158 |
| Interquartile 25% (IQ1) | $53,666 | $45,496 |
| Interquartile 75% (IQ3) | $73,079 | $59,129 |
| Interquartile Range (IQR) | $19,413 | $13,634 |
| Standard Deviation (Sample) | $20,808 | $13,383 |
| Standard Deviation (Population) | $20,532 | $13,278 |
Similar Demographics by Householder Income Over 65 years
Demographics Similar to Romanians by Householder Income Over 65 years
In terms of householder income over 65 years, the demographic groups most similar to Romanians are Assyrian/Chaldean/Syriac ($64,108, a difference of 0.050%), Immigrants from South Eastern Asia ($64,089, a difference of 0.080%), Sri Lankan ($64,201, a difference of 0.090%), Immigrants from Italy ($64,065, a difference of 0.12%), and Immigrants from Hungary ($64,277, a difference of 0.21%).
| Demographics | Rating | Rank | Householder Income Over 65 years |
| Immigrants | Oceania | 97.4 /100 | #91 | Exceptional $64,416 |
| Immigrants | Bulgaria | 97.3 /100 | #92 | Exceptional $64,379 |
| Jordanians | 97.1 /100 | #93 | Exceptional $64,313 |
| Immigrants | Egypt | 97.0 /100 | #94 | Exceptional $64,299 |
| Immigrants | Latvia | 97.0 /100 | #95 | Exceptional $64,298 |
| Immigrants | Hungary | 97.0 /100 | #96 | Exceptional $64,277 |
| Sri Lankans | 96.7 /100 | #97 | Exceptional $64,201 |
| Romanians | 96.5 /100 | #98 | Exceptional $64,142 |
| Assyrians/Chaldeans/Syriacs | 96.4 /100 | #99 | Exceptional $64,108 |
| Immigrants | South Eastern Asia | 96.3 /100 | #100 | Exceptional $64,089 |
| Immigrants | Italy | 96.2 /100 | #101 | Exceptional $64,065 |
| Chileans | 95.8 /100 | #102 | Exceptional $63,957 |
| British | 95.7 /100 | #103 | Exceptional $63,940 |
| Immigrants | Cameroon | 95.6 /100 | #104 | Exceptional $63,907 |
| Italians | 95.5 /100 | #105 | Exceptional $63,885 |
Demographics Similar to Immigrants from Laos by Householder Income Over 65 years
In terms of householder income over 65 years, the demographic groups most similar to Immigrants from Laos are Fijian ($56,768, a difference of 0.080%), Subsaharan African ($56,615, a difference of 0.19%), Immigrants from Panama ($56,944, a difference of 0.39%), Immigrants from Guyana ($56,495, a difference of 0.40%), and Immigrants from Uruguay ($56,975, a difference of 0.45%).
| Demographics | Rating | Rank | Householder Income Over 65 years |
| Immigrants | Venezuela | 2.3 /100 | #232 | Tragic $57,371 |
| Immigrants | Western Africa | 1.7 /100 | #233 | Tragic $57,119 |
| Immigrants | Burma/Myanmar | 1.7 /100 | #234 | Tragic $57,114 |
| Spanish Americans | 1.6 /100 | #235 | Tragic $57,021 |
| Immigrants | Uruguay | 1.5 /100 | #236 | Tragic $56,975 |
| Immigrants | Panama | 1.5 /100 | #237 | Tragic $56,944 |
| Fijians | 1.2 /100 | #238 | Tragic $56,768 |
| Immigrants | Laos | 1.2 /100 | #239 | Tragic $56,722 |
| Sub-Saharan Africans | 1.0 /100 | #240 | Tragic $56,615 |
| Immigrants | Guyana | 0.9 /100 | #241 | Tragic $56,495 |
| Yaqui | 0.8 /100 | #242 | Tragic $56,417 |
| Guyanese | 0.8 /100 | #243 | Tragic $56,351 |
| Hmong | 0.8 /100 | #244 | Tragic $56,339 |
| Immigrants | Uzbekistan | 0.8 /100 | #245 | Tragic $56,331 |
| Central Americans | 0.8 /100 | #246 | Tragic $56,321 |