Immigrants from North Macedonia vs Immigrants from Laos Ambulatory Disability
COMPARE
Immigrants from North Macedonia
Immigrants from Laos
Ambulatory Disability
Ambulatory Disability Comparison
Immigrants from North Macedonia
Immigrants from Laos
6.0%
AMBULATORY DISABILITY
84.1/ 100
METRIC RATING
136th/ 347
METRIC RANK
6.3%
AMBULATORY DISABILITY
13.2/ 100
METRIC RATING
210th/ 347
METRIC RANK
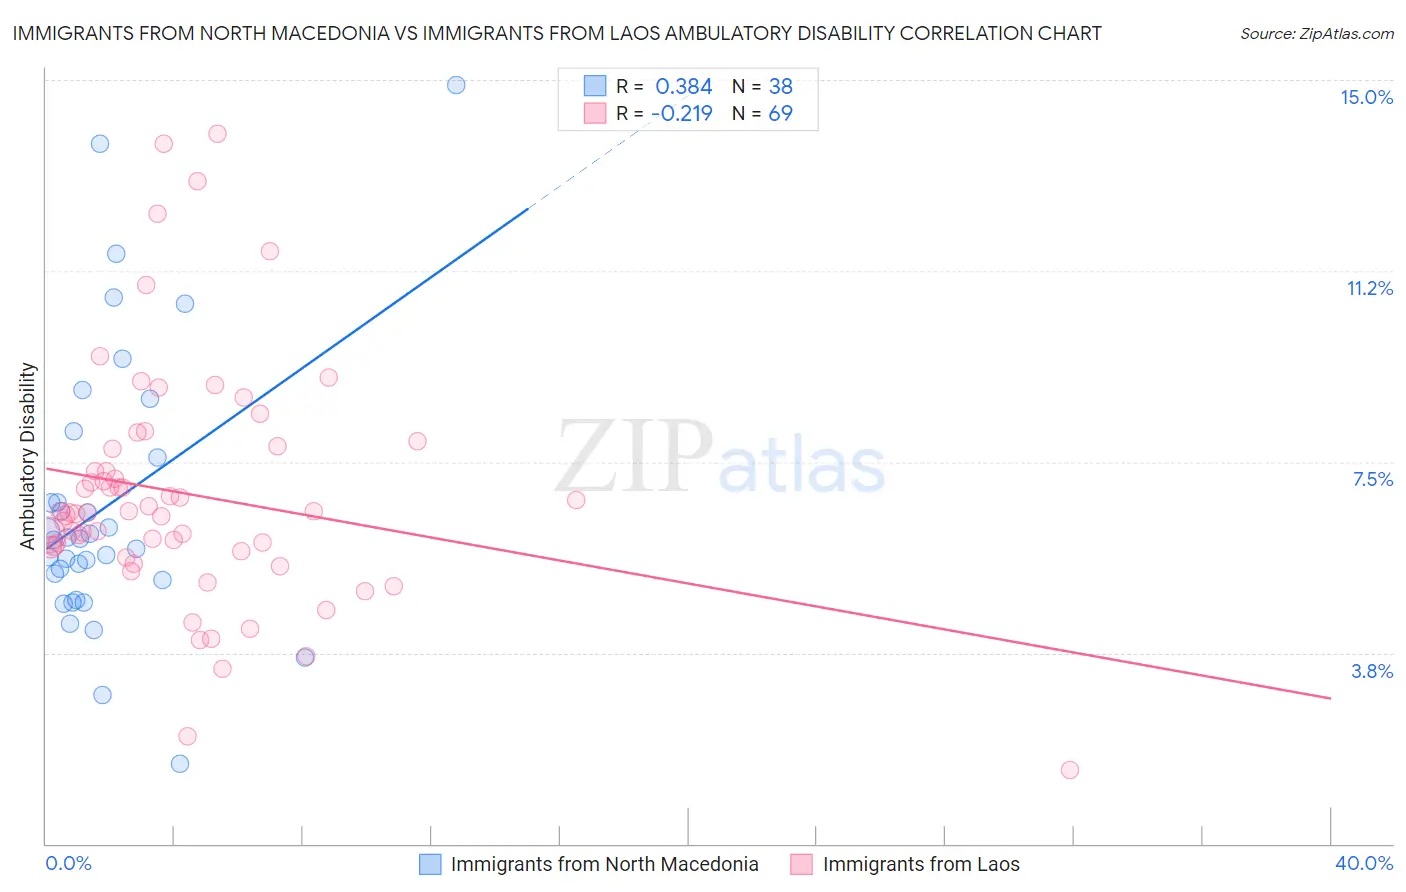
Immigrants from North Macedonia vs Immigrants from Laos Ambulatory Disability Correlation Chart
The statistical analysis conducted on geographies consisting of 74,316,752 people shows a mild positive correlation between the proportion of Immigrants from North Macedonia and percentage of population with ambulatory disability in the United States with a correlation coefficient (R) of 0.384 and weighted average of 6.0%. Similarly, the statistical analysis conducted on geographies consisting of 201,465,206 people shows a weak negative correlation between the proportion of Immigrants from Laos and percentage of population with ambulatory disability in the United States with a correlation coefficient (R) of -0.219 and weighted average of 6.3%, a difference of 4.8%.
Ambulatory Disability Correlation Summary
| Measurement | Immigrants from North Macedonia | Immigrants from Laos |
| Minimum | 1.6% | 1.4% |
| Maximum | 14.9% | 13.9% |
| Range | 13.3% | 12.5% |
| Mean | 6.6% | 6.9% |
| Median | 6.0% | 6.5% |
| Interquartile 25% (IQ1) | 5.2% | 5.8% |
| Interquartile 75% (IQ3) | 7.6% | 7.8% |
| Interquartile Range (IQR) | 2.4% | 2.0% |
| Standard Deviation (Sample) | 2.8% | 2.4% |
| Standard Deviation (Population) | 2.7% | 2.4% |
Similar Demographics by Ambulatory Disability
Demographics Similar to Immigrants from North Macedonia by Ambulatory Disability
In terms of ambulatory disability, the demographic groups most similar to Immigrants from North Macedonia are Immigrants from Syria (6.0%, a difference of 0.0%), Immigrants from Hungary (6.0%, a difference of 0.020%), Immigrants from Zaire (6.0%, a difference of 0.050%), Czech (6.0%, a difference of 0.080%), and Immigrants from Italy (6.0%, a difference of 0.090%).
| Demographics | Rating | Rank | Ambulatory Disability |
| Immigrants | Norway | 90.5 /100 | #129 | Exceptional 5.9% |
| Immigrants | Kazakhstan | 89.7 /100 | #130 | Excellent 5.9% |
| Immigrants | Costa Rica | 89.5 /100 | #131 | Excellent 5.9% |
| Immigrants | Europe | 87.8 /100 | #132 | Excellent 6.0% |
| Immigrants | Immigrants | 86.9 /100 | #133 | Excellent 6.0% |
| Ute | 86.6 /100 | #134 | Excellent 6.0% |
| Immigrants | Italy | 85.0 /100 | #135 | Excellent 6.0% |
| Immigrants | North Macedonia | 84.1 /100 | #136 | Excellent 6.0% |
| Immigrants | Syria | 84.1 /100 | #137 | Excellent 6.0% |
| Immigrants | Hungary | 83.9 /100 | #138 | Excellent 6.0% |
| Immigrants | Zaire | 83.6 /100 | #139 | Excellent 6.0% |
| Czechs | 83.3 /100 | #140 | Excellent 6.0% |
| Swedes | 83.1 /100 | #141 | Excellent 6.0% |
| Immigrants | Philippines | 83.0 /100 | #142 | Excellent 6.0% |
| Romanians | 82.9 /100 | #143 | Excellent 6.0% |
Demographics Similar to Immigrants from Laos by Ambulatory Disability
In terms of ambulatory disability, the demographic groups most similar to Immigrants from Laos are Immigrants from Iraq (6.3%, a difference of 0.080%), Bangladeshi (6.3%, a difference of 0.10%), Samoan (6.3%, a difference of 0.14%), Mexican American Indian (6.3%, a difference of 0.15%), and Japanese (6.3%, a difference of 0.15%).
| Demographics | Rating | Rank | Ambulatory Disability |
| Immigrants | Ukraine | 18.4 /100 | #203 | Poor 6.2% |
| Immigrants | Congo | 18.2 /100 | #204 | Poor 6.2% |
| Slovenes | 18.0 /100 | #205 | Poor 6.2% |
| Finns | 17.2 /100 | #206 | Poor 6.2% |
| Alsatians | 15.1 /100 | #207 | Poor 6.3% |
| Bangladeshis | 14.2 /100 | #208 | Poor 6.3% |
| Immigrants | Iraq | 14.0 /100 | #209 | Poor 6.3% |
| Immigrants | Laos | 13.2 /100 | #210 | Poor 6.3% |
| Samoans | 12.1 /100 | #211 | Poor 6.3% |
| Mexican American Indians | 12.0 /100 | #212 | Poor 6.3% |
| Japanese | 12.0 /100 | #213 | Poor 6.3% |
| Immigrants | Mexico | 11.0 /100 | #214 | Poor 6.3% |
| Immigrants | Latin America | 11.0 /100 | #215 | Poor 6.3% |
| Canadians | 10.9 /100 | #216 | Poor 6.3% |
| Yugoslavians | 10.9 /100 | #217 | Poor 6.3% |