Pennsylvania German vs Marshallese Unemployment Among Women with Children Under 18 years
COMPARE
Pennsylvania German
Marshallese
Unemployment Among Women with Children Under 18 years
Unemployment Among Women with Children Under 18 years Comparison
Pennsylvania Germans
Marshallese
5.7%
UNEMPLOYMENT AMONG WOMEN WITH CHILDREN UNDER 18 YEARS
5.7/ 100
METRIC RATING
221st/ 347
METRIC RANK
5.6%
UNEMPLOYMENT AMONG WOMEN WITH CHILDREN UNDER 18 YEARS
20.2/ 100
METRIC RATING
199th/ 347
METRIC RANK
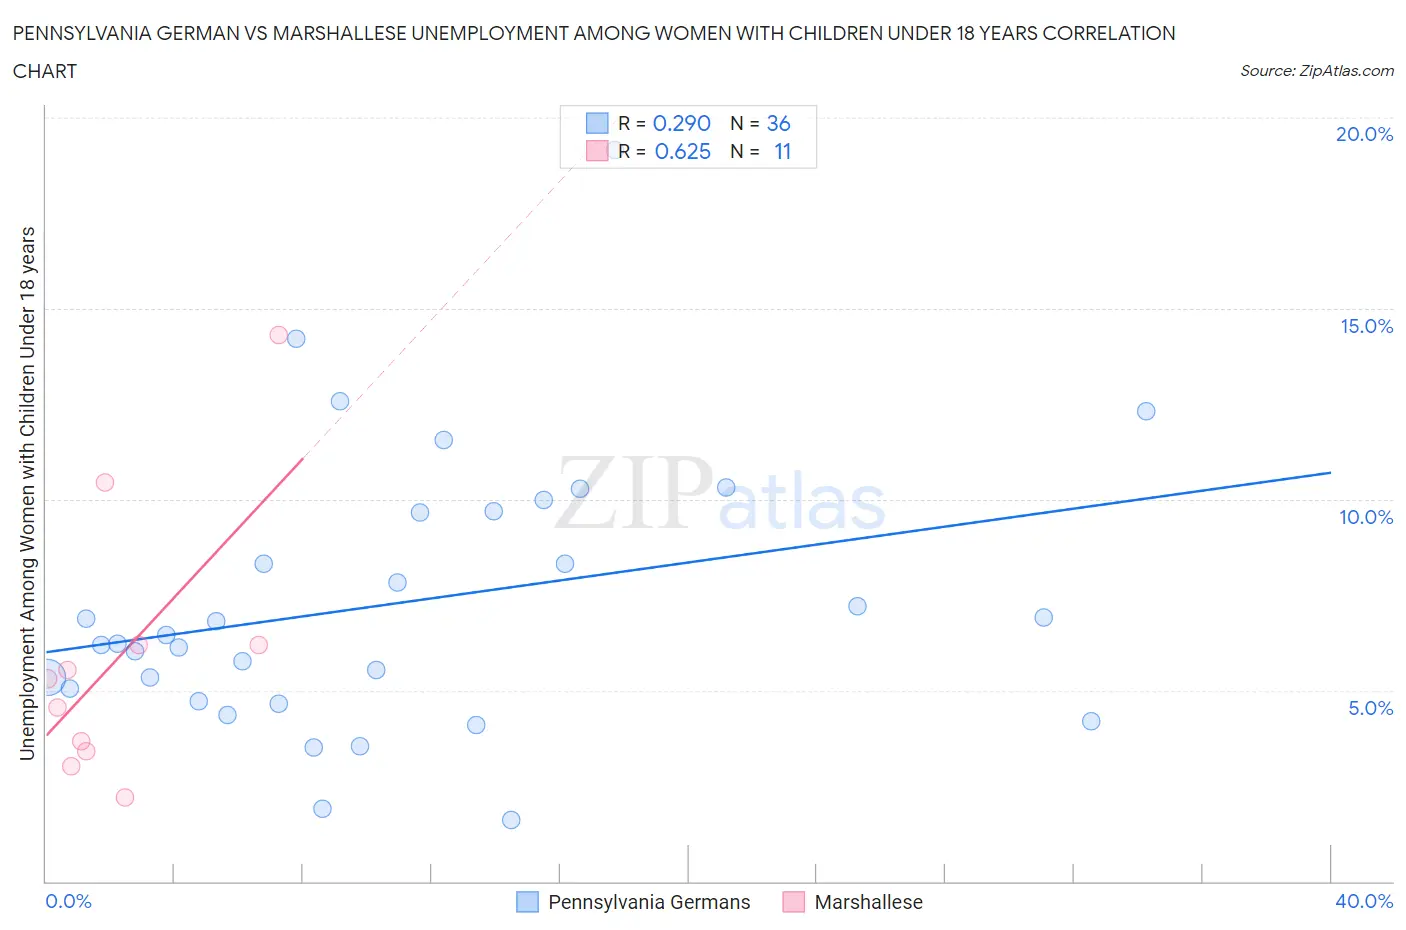
Pennsylvania German vs Marshallese Unemployment Among Women with Children Under 18 years Correlation Chart
The statistical analysis conducted on geographies consisting of 223,295,568 people shows a weak positive correlation between the proportion of Pennsylvania Germans and unemployment rate among women with children under the age of 18 in the United States with a correlation coefficient (R) of 0.290 and weighted average of 5.7%. Similarly, the statistical analysis conducted on geographies consisting of 14,610,799 people shows a significant positive correlation between the proportion of Marshallese and unemployment rate among women with children under the age of 18 in the United States with a correlation coefficient (R) of 0.625 and weighted average of 5.6%, a difference of 2.5%.
Unemployment Among Women with Children Under 18 years Correlation Summary
| Measurement | Pennsylvania German | Marshallese |
| Minimum | 1.6% | 2.2% |
| Maximum | 19.2% | 14.3% |
| Range | 17.6% | 12.1% |
| Mean | 7.3% | 5.9% |
| Median | 6.3% | 5.3% |
| Interquartile 25% (IQ1) | 4.9% | 3.4% |
| Interquartile 75% (IQ3) | 9.7% | 6.2% |
| Interquartile Range (IQR) | 4.8% | 2.8% |
| Standard Deviation (Sample) | 3.6% | 3.6% |
| Standard Deviation (Population) | 3.6% | 3.4% |
Similar Demographics by Unemployment Among Women with Children Under 18 years
Demographics Similar to Pennsylvania Germans by Unemployment Among Women with Children Under 18 years
In terms of unemployment among women with children under 18 years, the demographic groups most similar to Pennsylvania Germans are Immigrants from Fiji (5.7%, a difference of 0.18%), Osage (5.7%, a difference of 0.22%), Iroquois (5.7%, a difference of 0.24%), Potawatomi (5.7%, a difference of 0.24%), and Immigrants from Nicaragua (5.7%, a difference of 0.37%).
| Demographics | Rating | Rank | Unemployment Among Women with Children Under 18 years |
| Japanese | 8.7 /100 | #214 | Tragic 5.7% |
| Immigrants | Uganda | 7.9 /100 | #215 | Tragic 5.7% |
| Immigrants | Peru | 7.4 /100 | #216 | Tragic 5.7% |
| Immigrants | Brazil | 7.1 /100 | #217 | Tragic 5.7% |
| Immigrants | Nicaragua | 7.0 /100 | #218 | Tragic 5.7% |
| Iroquois | 6.5 /100 | #219 | Tragic 5.7% |
| Immigrants | Fiji | 6.3 /100 | #220 | Tragic 5.7% |
| Pennsylvania Germans | 5.7 /100 | #221 | Tragic 5.7% |
| Osage | 5.0 /100 | #222 | Tragic 5.7% |
| Potawatomi | 5.0 /100 | #223 | Tragic 5.7% |
| Immigrants | Syria | 4.6 /100 | #224 | Tragic 5.7% |
| Armenians | 4.5 /100 | #225 | Tragic 5.7% |
| Cherokee | 4.3 /100 | #226 | Tragic 5.7% |
| Sierra Leoneans | 3.8 /100 | #227 | Tragic 5.8% |
| Somalis | 3.5 /100 | #228 | Tragic 5.8% |
Demographics Similar to Marshallese by Unemployment Among Women with Children Under 18 years
In terms of unemployment among women with children under 18 years, the demographic groups most similar to Marshallese are Immigrants from Colombia (5.6%, a difference of 0.13%), Arab (5.6%, a difference of 0.13%), Menominee (5.6%, a difference of 0.18%), Immigrants from Morocco (5.6%, a difference of 0.26%), and Spaniard (5.6%, a difference of 0.27%).
| Demographics | Rating | Rank | Unemployment Among Women with Children Under 18 years |
| Immigrants | Spain | 30.7 /100 | #192 | Fair 5.5% |
| Immigrants | Afghanistan | 29.3 /100 | #193 | Fair 5.5% |
| Immigrants | Chile | 29.2 /100 | #194 | Fair 5.5% |
| Colombians | 22.8 /100 | #195 | Fair 5.6% |
| Spaniards | 22.8 /100 | #196 | Fair 5.6% |
| Immigrants | Colombia | 21.4 /100 | #197 | Fair 5.6% |
| Arabs | 21.4 /100 | #198 | Fair 5.6% |
| Marshallese | 20.2 /100 | #199 | Fair 5.6% |
| Menominee | 18.6 /100 | #200 | Poor 5.6% |
| Immigrants | Morocco | 17.9 /100 | #201 | Poor 5.6% |
| Immigrants | Micronesia | 17.1 /100 | #202 | Poor 5.6% |
| Portuguese | 15.9 /100 | #203 | Poor 5.6% |
| Israelis | 15.6 /100 | #204 | Poor 5.6% |
| Tsimshian | 15.2 /100 | #205 | Poor 5.6% |
| Nicaraguans | 12.3 /100 | #206 | Poor 5.6% |