Pennsylvania German vs Marshallese In Labor Force | Age 35-44
COMPARE
Pennsylvania German
Marshallese
In Labor Force | Age 35-44
In Labor Force | Age 35-44 Comparison
Pennsylvania Germans
Marshallese
82.9%
IN LABOR FORCE | AGE 35-44
0.0/ 100
METRIC RATING
291st/ 347
METRIC RANK
82.4%
IN LABOR FORCE | AGE 35-44
0.0/ 100
METRIC RATING
304th/ 347
METRIC RANK
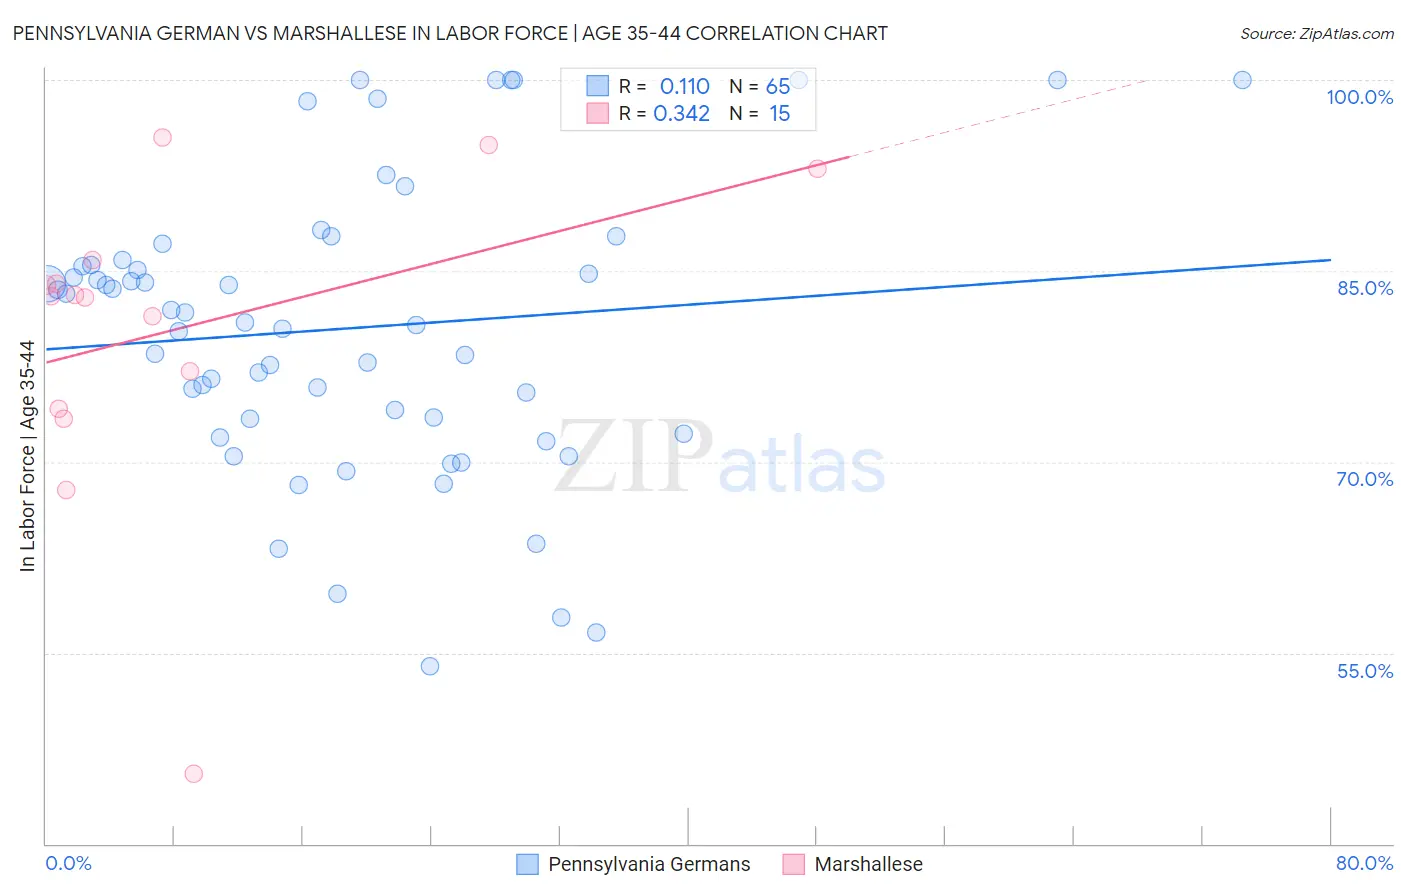
Pennsylvania German vs Marshallese In Labor Force | Age 35-44 Correlation Chart
The statistical analysis conducted on geographies consisting of 234,051,901 people shows a poor positive correlation between the proportion of Pennsylvania Germans and labor force participation rate among population between the ages 35 and 44 in the United States with a correlation coefficient (R) of 0.110 and weighted average of 82.9%. Similarly, the statistical analysis conducted on geographies consisting of 14,760,991 people shows a mild positive correlation between the proportion of Marshallese and labor force participation rate among population between the ages 35 and 44 in the United States with a correlation coefficient (R) of 0.342 and weighted average of 82.4%, a difference of 0.58%.
In Labor Force | Age 35-44 Correlation Summary
| Measurement | Pennsylvania German | Marshallese |
| Minimum | 53.9% | 45.5% |
| Maximum | 100.0% | 95.5% |
| Range | 46.1% | 50.0% |
| Mean | 80.5% | 80.4% |
| Median | 81.0% | 83.0% |
| Interquartile 25% (IQ1) | 72.8% | 74.1% |
| Interquartile 75% (IQ3) | 85.7% | 85.9% |
| Interquartile Range (IQR) | 12.9% | 11.8% |
| Standard Deviation (Sample) | 11.3% | 12.4% |
| Standard Deviation (Population) | 11.2% | 12.0% |
Demographics Similar to Pennsylvania Germans and Marshallese by In Labor Force | Age 35-44
In terms of in labor force | age 35-44, the demographic groups most similar to Pennsylvania Germans are African (82.9%, a difference of 0.020%), Chippewa (82.9%, a difference of 0.030%), Puget Sound Salish (82.9%, a difference of 0.040%), Immigrants from Latin America (82.8%, a difference of 0.050%), and Immigrants from Belize (82.9%, a difference of 0.060%). Similarly, the demographic groups most similar to Marshallese are American (82.4%, a difference of 0.010%), Nepalese (82.4%, a difference of 0.010%), Spanish American Indian (82.5%, a difference of 0.080%), Central American Indian (82.5%, a difference of 0.11%), and Tlingit-Haida (82.5%, a difference of 0.17%).
| Demographics | Rating | Rank | In Labor Force | Age 35-44 |
| Immigrants | Belize | 0.0 /100 | #287 | Tragic 82.9% |
| Puget Sound Salish | 0.0 /100 | #288 | Tragic 82.9% |
| Chippewa | 0.0 /100 | #289 | Tragic 82.9% |
| Africans | 0.0 /100 | #290 | Tragic 82.9% |
| Pennsylvania Germans | 0.0 /100 | #291 | Tragic 82.9% |
| Immigrants | Latin America | 0.0 /100 | #292 | Tragic 82.8% |
| Spanish Americans | 0.0 /100 | #293 | Tragic 82.8% |
| Potawatomi | 0.0 /100 | #294 | Tragic 82.7% |
| Immigrants | Lebanon | 0.0 /100 | #295 | Tragic 82.7% |
| Mexican American Indians | 0.0 /100 | #296 | Tragic 82.6% |
| Hmong | 0.0 /100 | #297 | Tragic 82.6% |
| Ottawa | 0.0 /100 | #298 | Tragic 82.6% |
| Tlingit-Haida | 0.0 /100 | #299 | Tragic 82.5% |
| Central American Indians | 0.0 /100 | #300 | Tragic 82.5% |
| Spanish American Indians | 0.0 /100 | #301 | Tragic 82.5% |
| Americans | 0.0 /100 | #302 | Tragic 82.4% |
| Nepalese | 0.0 /100 | #303 | Tragic 82.4% |
| Marshallese | 0.0 /100 | #304 | Tragic 82.4% |
| Shoshone | 0.0 /100 | #305 | Tragic 82.2% |
| Blacks/African Americans | 0.0 /100 | #306 | Tragic 82.2% |
| Hispanics or Latinos | 0.0 /100 | #307 | Tragic 82.1% |