Paraguayan vs Marshallese Disability Age 5 to 17
COMPARE
Paraguayan
Marshallese
Disability Age 5 to 17
Disability Age 5 to 17 Comparison
Paraguayans
Marshallese
5.1%
DISABILITY AGE 5 TO 17
99.9/ 100
METRIC RATING
54th/ 347
METRIC RANK
5.7%
DISABILITY AGE 5 TO 17
28.1/ 100
METRIC RATING
188th/ 347
METRIC RANK
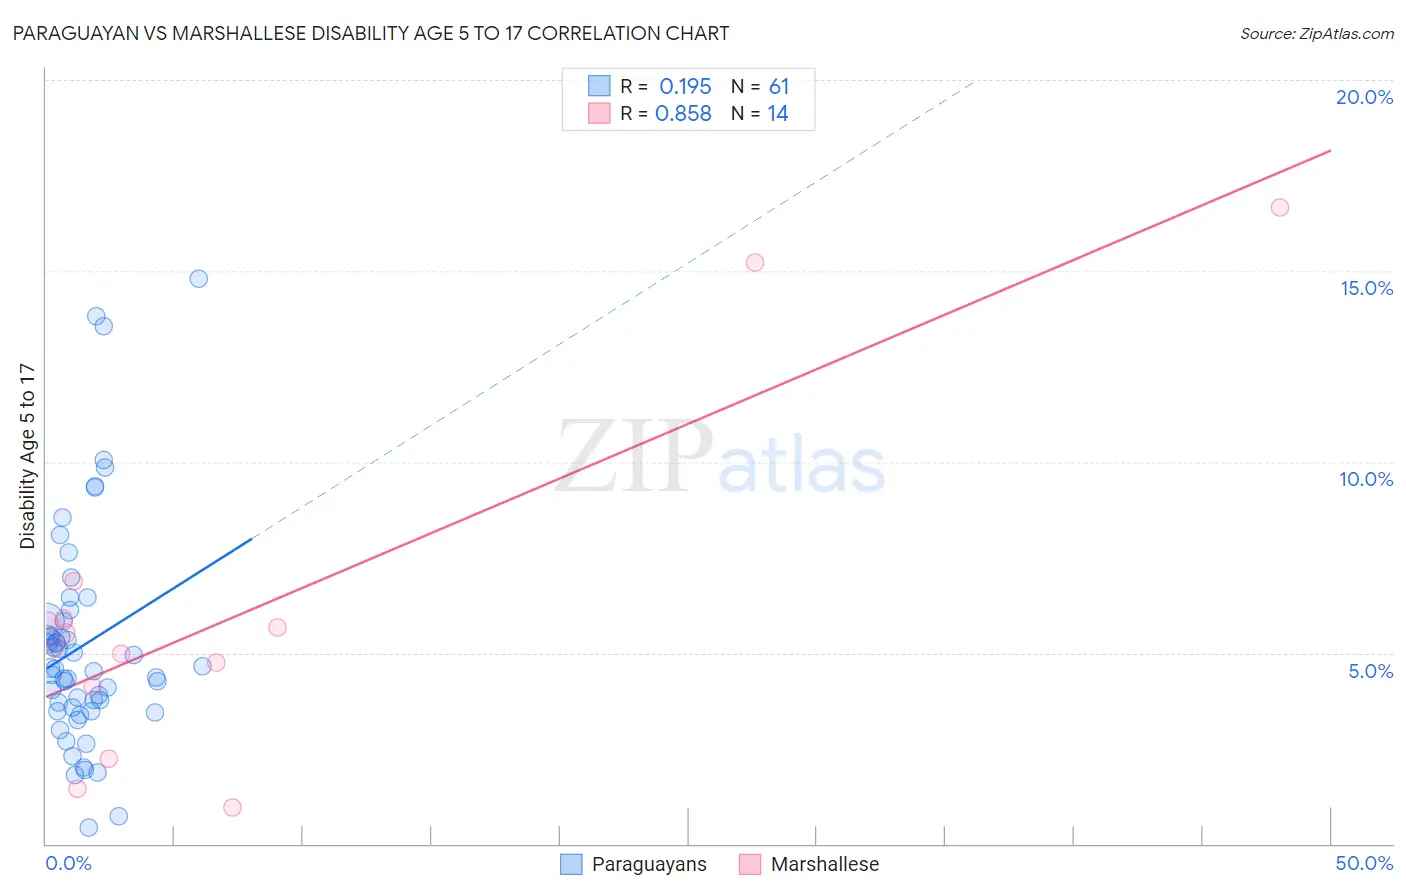
Paraguayan vs Marshallese Disability Age 5 to 17 Correlation Chart
The statistical analysis conducted on geographies consisting of 94,920,755 people shows a poor positive correlation between the proportion of Paraguayans and percentage of population with a disability between the ages 5 and 17 in the United States with a correlation coefficient (R) of 0.195 and weighted average of 5.1%. Similarly, the statistical analysis conducted on geographies consisting of 14,753,220 people shows a very strong positive correlation between the proportion of Marshallese and percentage of population with a disability between the ages 5 and 17 in the United States with a correlation coefficient (R) of 0.858 and weighted average of 5.7%, a difference of 10.8%.
Disability Age 5 to 17 Correlation Summary
| Measurement | Paraguayan | Marshallese |
| Minimum | 0.43% | 0.94% |
| Maximum | 14.8% | 16.7% |
| Range | 14.4% | 15.7% |
| Mean | 5.2% | 6.1% |
| Median | 4.6% | 5.3% |
| Interquartile 25% (IQ1) | 3.5% | 4.1% |
| Interquartile 75% (IQ3) | 5.8% | 5.9% |
| Interquartile Range (IQR) | 2.3% | 1.8% |
| Standard Deviation (Sample) | 2.9% | 4.5% |
| Standard Deviation (Population) | 2.9% | 4.4% |
Similar Demographics by Disability Age 5 to 17
Demographics Similar to Paraguayans by Disability Age 5 to 17
In terms of disability age 5 to 17, the demographic groups most similar to Paraguayans are Immigrants from Lithuania (5.1%, a difference of 0.030%), Laotian (5.1%, a difference of 0.040%), Immigrants from Turkey (5.1%, a difference of 0.060%), Immigrants from Fiji (5.1%, a difference of 0.080%), and Turkish (5.1%, a difference of 0.17%).
| Demographics | Rating | Rank | Disability Age 5 to 17 |
| Vietnamese | 100.0 /100 | #47 | Exceptional 5.1% |
| Koreans | 100.0 /100 | #48 | Exceptional 5.1% |
| Immigrants | Western Asia | 100.0 /100 | #49 | Exceptional 5.1% |
| Argentineans | 99.9 /100 | #50 | Exceptional 5.1% |
| Turks | 99.9 /100 | #51 | Exceptional 5.1% |
| Immigrants | Fiji | 99.9 /100 | #52 | Exceptional 5.1% |
| Immigrants | Lithuania | 99.9 /100 | #53 | Exceptional 5.1% |
| Paraguayans | 99.9 /100 | #54 | Exceptional 5.1% |
| Laotians | 99.9 /100 | #55 | Exceptional 5.1% |
| Immigrants | Turkey | 99.9 /100 | #56 | Exceptional 5.1% |
| Immigrants | Poland | 99.9 /100 | #57 | Exceptional 5.1% |
| Immigrants | Ukraine | 99.9 /100 | #58 | Exceptional 5.1% |
| Immigrants | North Macedonia | 99.9 /100 | #59 | Exceptional 5.1% |
| Immigrants | Eastern Europe | 99.9 /100 | #60 | Exceptional 5.1% |
| Immigrants | Switzerland | 99.8 /100 | #61 | Exceptional 5.2% |
Demographics Similar to Marshallese by Disability Age 5 to 17
In terms of disability age 5 to 17, the demographic groups most similar to Marshallese are Pueblo (5.7%, a difference of 0.040%), Immigrants from Eastern Africa (5.7%, a difference of 0.050%), Danish (5.7%, a difference of 0.10%), Immigrants from Bosnia and Herzegovina (5.7%, a difference of 0.11%), and Immigrants from Thailand (5.7%, a difference of 0.12%).
| Demographics | Rating | Rank | Disability Age 5 to 17 |
| Immigrants | England | 36.4 /100 | #181 | Fair 5.6% |
| Mexican American Indians | 35.2 /100 | #182 | Fair 5.6% |
| Immigrants | Latin America | 34.3 /100 | #183 | Fair 5.6% |
| Syrians | 33.8 /100 | #184 | Fair 5.6% |
| Immigrants | Mexico | 33.7 /100 | #185 | Fair 5.6% |
| Fijians | 31.7 /100 | #186 | Fair 5.7% |
| Immigrants | Thailand | 30.2 /100 | #187 | Fair 5.7% |
| Marshallese | 28.1 /100 | #188 | Fair 5.7% |
| Pueblo | 27.5 /100 | #189 | Fair 5.7% |
| Immigrants | Eastern Africa | 27.3 /100 | #190 | Fair 5.7% |
| Danes | 26.5 /100 | #191 | Fair 5.7% |
| Immigrants | Bosnia and Herzegovina | 26.3 /100 | #192 | Fair 5.7% |
| Immigrants | Canada | 26.1 /100 | #193 | Fair 5.7% |
| Croatians | 23.6 /100 | #194 | Fair 5.7% |
| Immigrants | Nigeria | 23.4 /100 | #195 | Fair 5.7% |