Bahamian vs Marshallese Disability Age 5 to 17
COMPARE
Bahamian
Marshallese
Disability Age 5 to 17
Disability Age 5 to 17 Comparison
Bahamians
Marshallese
6.3%
DISABILITY AGE 5 TO 17
0.0/ 100
METRIC RATING
307th/ 347
METRIC RANK
5.7%
DISABILITY AGE 5 TO 17
28.1/ 100
METRIC RATING
188th/ 347
METRIC RANK
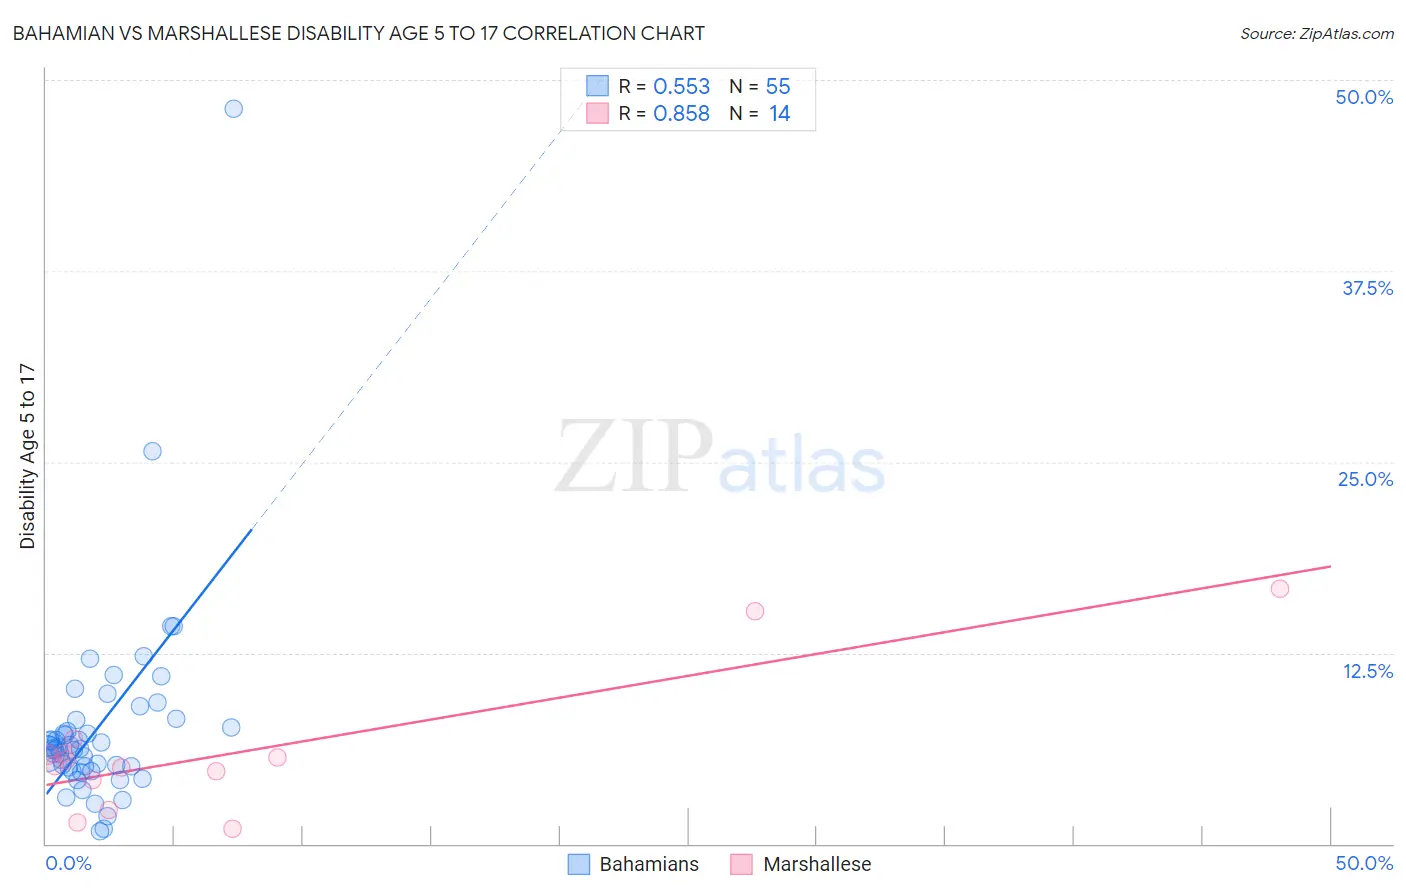
Bahamian vs Marshallese Disability Age 5 to 17 Correlation Chart
The statistical analysis conducted on geographies consisting of 112,302,406 people shows a substantial positive correlation between the proportion of Bahamians and percentage of population with a disability between the ages 5 and 17 in the United States with a correlation coefficient (R) of 0.553 and weighted average of 6.3%. Similarly, the statistical analysis conducted on geographies consisting of 14,753,220 people shows a very strong positive correlation between the proportion of Marshallese and percentage of population with a disability between the ages 5 and 17 in the United States with a correlation coefficient (R) of 0.858 and weighted average of 5.7%, a difference of 11.6%.
Disability Age 5 to 17 Correlation Summary
| Measurement | Bahamian | Marshallese |
| Minimum | 0.80% | 0.94% |
| Maximum | 48.1% | 16.7% |
| Range | 47.4% | 15.7% |
| Mean | 7.6% | 6.1% |
| Median | 6.2% | 5.3% |
| Interquartile 25% (IQ1) | 5.0% | 4.1% |
| Interquartile 75% (IQ3) | 8.1% | 5.9% |
| Interquartile Range (IQR) | 3.1% | 1.8% |
| Standard Deviation (Sample) | 6.8% | 4.5% |
| Standard Deviation (Population) | 6.7% | 4.4% |
Similar Demographics by Disability Age 5 to 17
Demographics Similar to Bahamians by Disability Age 5 to 17
In terms of disability age 5 to 17, the demographic groups most similar to Bahamians are Nonimmigrants (6.3%, a difference of 0.14%), Scotch-Irish (6.3%, a difference of 0.23%), Native/Alaskan (6.3%, a difference of 0.24%), Hmong (6.3%, a difference of 0.26%), and Senegalese (6.3%, a difference of 0.38%).
| Demographics | Rating | Rank | Disability Age 5 to 17 |
| Carpatho Rusyns | 0.0 /100 | #300 | Tragic 6.3% |
| U.S. Virgin Islanders | 0.0 /100 | #301 | Tragic 6.3% |
| Celtics | 0.0 /100 | #302 | Tragic 6.3% |
| Yakama | 0.0 /100 | #303 | Tragic 6.3% |
| Senegalese | 0.0 /100 | #304 | Tragic 6.3% |
| Natives/Alaskans | 0.0 /100 | #305 | Tragic 6.3% |
| Immigrants | Nonimmigrants | 0.0 /100 | #306 | Tragic 6.3% |
| Bahamians | 0.0 /100 | #307 | Tragic 6.3% |
| Scotch-Irish | 0.0 /100 | #308 | Tragic 6.3% |
| Hmong | 0.0 /100 | #309 | Tragic 6.3% |
| Alaskan Athabascans | 0.0 /100 | #310 | Tragic 6.3% |
| Immigrants | Dominica | 0.0 /100 | #311 | Tragic 6.3% |
| Bermudans | 0.0 /100 | #312 | Tragic 6.4% |
| Apache | 0.0 /100 | #313 | Tragic 6.4% |
| French | 0.0 /100 | #314 | Tragic 6.4% |
Demographics Similar to Marshallese by Disability Age 5 to 17
In terms of disability age 5 to 17, the demographic groups most similar to Marshallese are Pueblo (5.7%, a difference of 0.040%), Immigrants from Eastern Africa (5.7%, a difference of 0.050%), Danish (5.7%, a difference of 0.10%), Immigrants from Bosnia and Herzegovina (5.7%, a difference of 0.11%), and Immigrants from Thailand (5.7%, a difference of 0.12%).
| Demographics | Rating | Rank | Disability Age 5 to 17 |
| Immigrants | England | 36.4 /100 | #181 | Fair 5.6% |
| Mexican American Indians | 35.2 /100 | #182 | Fair 5.6% |
| Immigrants | Latin America | 34.3 /100 | #183 | Fair 5.6% |
| Syrians | 33.8 /100 | #184 | Fair 5.6% |
| Immigrants | Mexico | 33.7 /100 | #185 | Fair 5.6% |
| Fijians | 31.7 /100 | #186 | Fair 5.7% |
| Immigrants | Thailand | 30.2 /100 | #187 | Fair 5.7% |
| Marshallese | 28.1 /100 | #188 | Fair 5.7% |
| Pueblo | 27.5 /100 | #189 | Fair 5.7% |
| Immigrants | Eastern Africa | 27.3 /100 | #190 | Fair 5.7% |
| Danes | 26.5 /100 | #191 | Fair 5.7% |
| Immigrants | Bosnia and Herzegovina | 26.3 /100 | #192 | Fair 5.7% |
| Immigrants | Canada | 26.1 /100 | #193 | Fair 5.7% |
| Croatians | 23.6 /100 | #194 | Fair 5.7% |
| Immigrants | Nigeria | 23.4 /100 | #195 | Fair 5.7% |