Pennsylvania German vs Lumbee In Labor Force | Age 35-44
COMPARE
Pennsylvania German
Lumbee
In Labor Force | Age 35-44
In Labor Force | Age 35-44 Comparison
Pennsylvania Germans
Lumbee
82.9%
IN LABOR FORCE | AGE 35-44
0.0/ 100
METRIC RATING
291st/ 347
METRIC RANK
77.0%
IN LABOR FORCE | AGE 35-44
0.0/ 100
METRIC RATING
340th/ 347
METRIC RANK
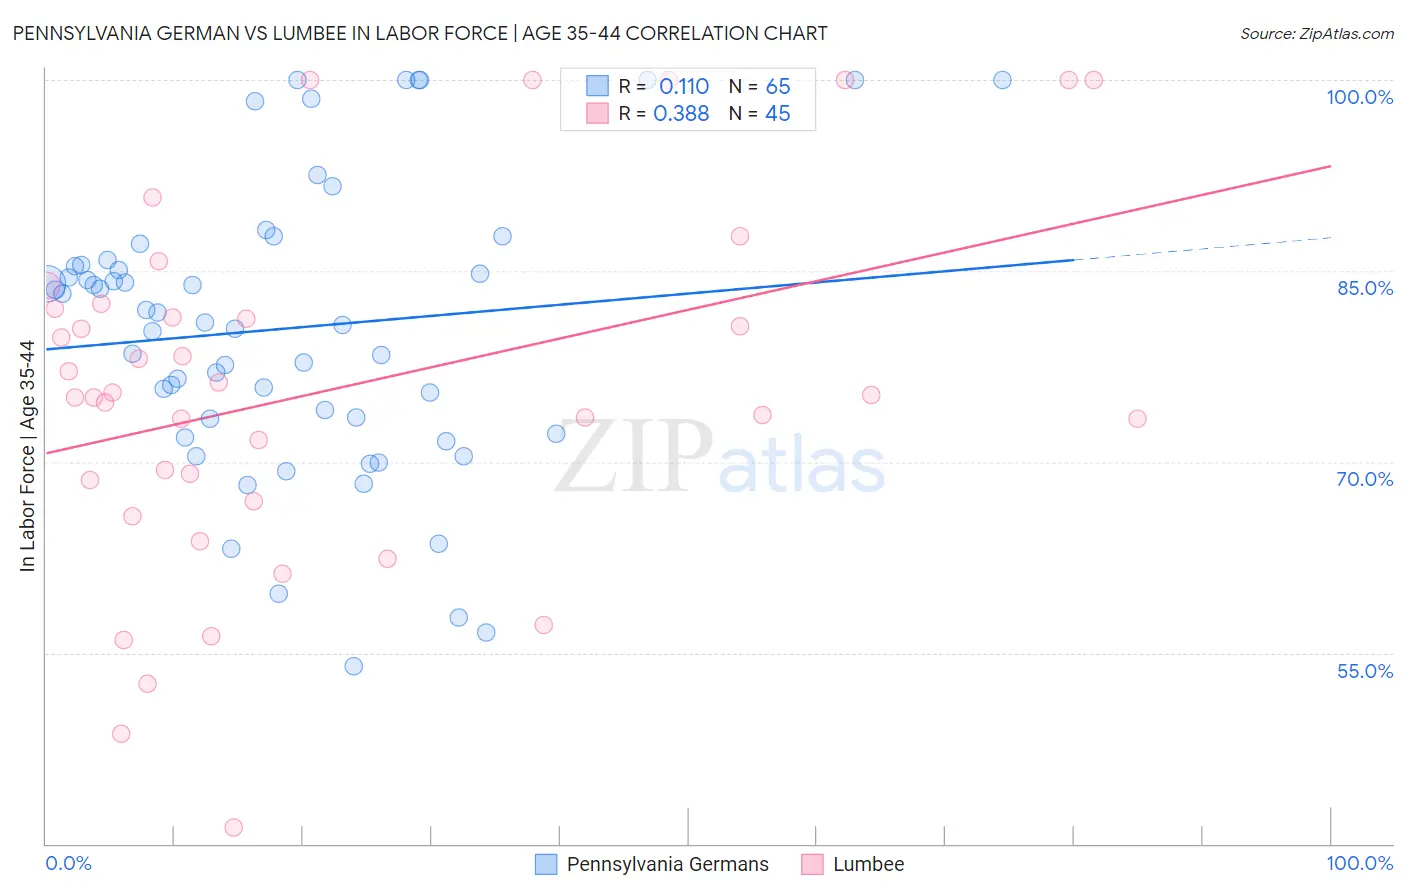
Pennsylvania German vs Lumbee In Labor Force | Age 35-44 Correlation Chart
The statistical analysis conducted on geographies consisting of 234,051,901 people shows a poor positive correlation between the proportion of Pennsylvania Germans and labor force participation rate among population between the ages 35 and 44 in the United States with a correlation coefficient (R) of 0.110 and weighted average of 82.9%. Similarly, the statistical analysis conducted on geographies consisting of 92,275,776 people shows a mild positive correlation between the proportion of Lumbee and labor force participation rate among population between the ages 35 and 44 in the United States with a correlation coefficient (R) of 0.388 and weighted average of 77.0%, a difference of 7.6%.
In Labor Force | Age 35-44 Correlation Summary
| Measurement | Pennsylvania German | Lumbee |
| Minimum | 53.9% | 41.3% |
| Maximum | 100.0% | 100.0% |
| Range | 46.1% | 58.7% |
| Mean | 80.5% | 75.7% |
| Median | 81.0% | 75.3% |
| Interquartile 25% (IQ1) | 72.8% | 67.7% |
| Interquartile 75% (IQ3) | 85.7% | 82.2% |
| Interquartile Range (IQR) | 12.9% | 14.5% |
| Standard Deviation (Sample) | 11.3% | 14.1% |
| Standard Deviation (Population) | 11.2% | 13.9% |
Similar Demographics by In Labor Force | Age 35-44
Demographics Similar to Pennsylvania Germans by In Labor Force | Age 35-44
In terms of in labor force | age 35-44, the demographic groups most similar to Pennsylvania Germans are African (82.9%, a difference of 0.020%), Chippewa (82.9%, a difference of 0.030%), Puget Sound Salish (82.9%, a difference of 0.040%), Immigrants from Latin America (82.8%, a difference of 0.050%), and Fijian (82.9%, a difference of 0.060%).
| Demographics | Rating | Rank | In Labor Force | Age 35-44 |
| Immigrants | Dominican Republic | 0.0 /100 | #284 | Tragic 82.9% |
| Fijians | 0.0 /100 | #285 | Tragic 82.9% |
| Immigrants | Bangladesh | 0.0 /100 | #286 | Tragic 82.9% |
| Immigrants | Belize | 0.0 /100 | #287 | Tragic 82.9% |
| Puget Sound Salish | 0.0 /100 | #288 | Tragic 82.9% |
| Chippewa | 0.0 /100 | #289 | Tragic 82.9% |
| Africans | 0.0 /100 | #290 | Tragic 82.9% |
| Pennsylvania Germans | 0.0 /100 | #291 | Tragic 82.9% |
| Immigrants | Latin America | 0.0 /100 | #292 | Tragic 82.8% |
| Spanish Americans | 0.0 /100 | #293 | Tragic 82.8% |
| Potawatomi | 0.0 /100 | #294 | Tragic 82.7% |
| Immigrants | Lebanon | 0.0 /100 | #295 | Tragic 82.7% |
| Mexican American Indians | 0.0 /100 | #296 | Tragic 82.6% |
| Hmong | 0.0 /100 | #297 | Tragic 82.6% |
| Ottawa | 0.0 /100 | #298 | Tragic 82.6% |
Demographics Similar to Lumbee by In Labor Force | Age 35-44
In terms of in labor force | age 35-44, the demographic groups most similar to Lumbee are Hopi (77.0%, a difference of 0.050%), Yup'ik (77.3%, a difference of 0.35%), Pueblo (77.4%, a difference of 0.46%), Crow (76.5%, a difference of 0.69%), and Immigrants from Yemen (76.3%, a difference of 0.93%).
| Demographics | Rating | Rank | In Labor Force | Age 35-44 |
| Kiowa | 0.0 /100 | #333 | Tragic 79.2% |
| Yakama | 0.0 /100 | #334 | Tragic 79.0% |
| Natives/Alaskans | 0.0 /100 | #335 | Tragic 78.9% |
| Arapaho | 0.0 /100 | #336 | Tragic 78.1% |
| Apache | 0.0 /100 | #337 | Tragic 77.9% |
| Pueblo | 0.0 /100 | #338 | Tragic 77.4% |
| Yup'ik | 0.0 /100 | #339 | Tragic 77.3% |
| Lumbee | 0.0 /100 | #340 | Tragic 77.0% |
| Hopi | 0.0 /100 | #341 | Tragic 77.0% |
| Crow | 0.0 /100 | #342 | Tragic 76.5% |
| Immigrants | Yemen | 0.0 /100 | #343 | Tragic 76.3% |
| Pima | 0.0 /100 | #344 | Tragic 74.8% |
| Yuman | 0.0 /100 | #345 | Tragic 74.7% |
| Tohono O'odham | 0.0 /100 | #346 | Tragic 74.1% |
| Navajo | 0.0 /100 | #347 | Tragic 73.8% |