Immigrants from Peru vs Lumbee Disability Age 5 to 17
COMPARE
Immigrants from Peru
Lumbee
Disability Age 5 to 17
Disability Age 5 to 17 Comparison
Immigrants from Peru
Lumbee
5.3%
DISABILITY AGE 5 TO 17
99.1/ 100
METRIC RATING
93rd/ 347
METRIC RANK
6.2%
DISABILITY AGE 5 TO 17
0.0/ 100
METRIC RATING
298th/ 347
METRIC RANK
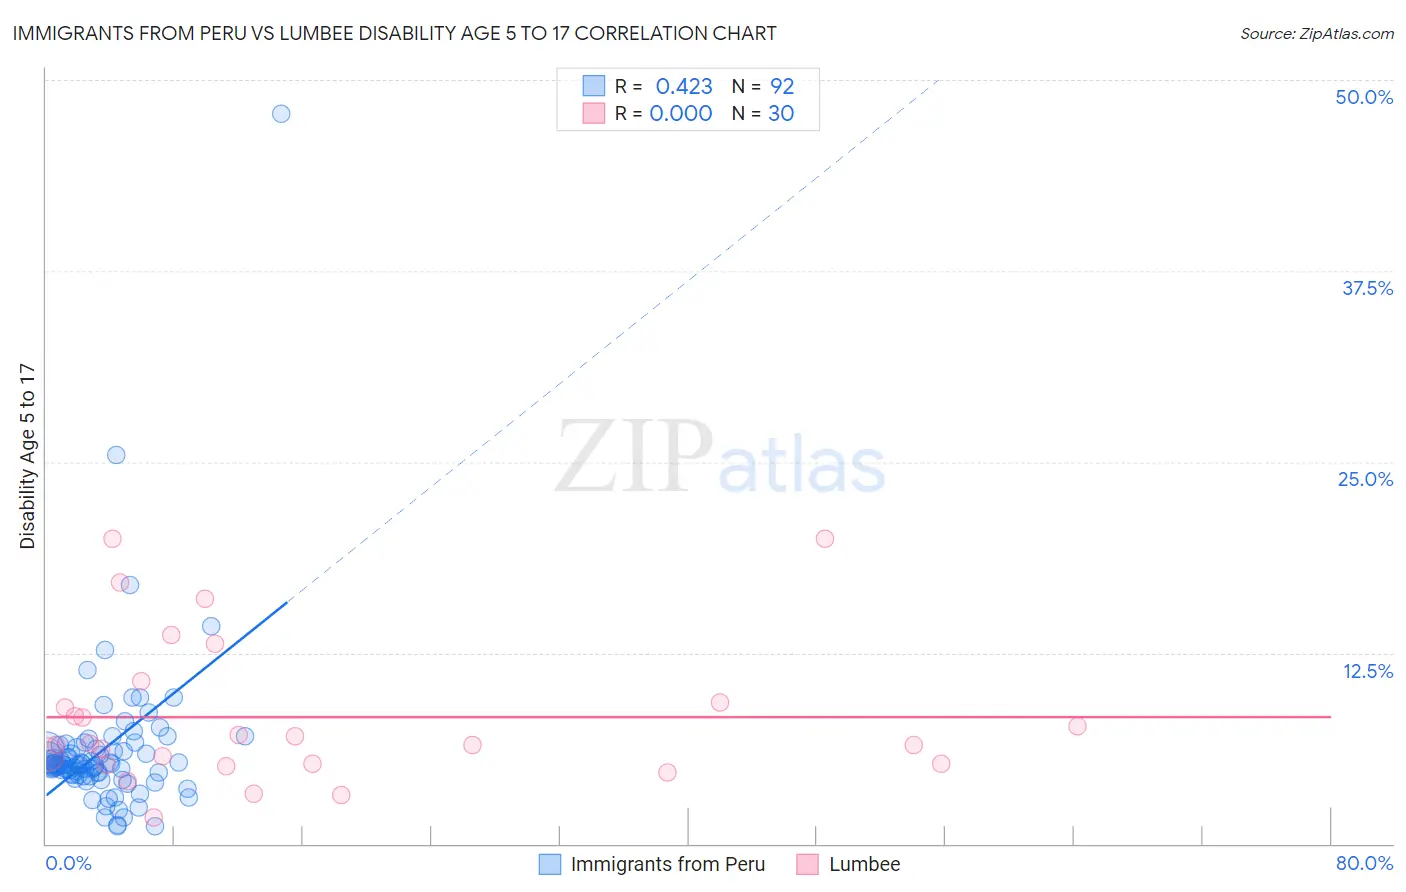
Immigrants from Peru vs Lumbee Disability Age 5 to 17 Correlation Chart
The statistical analysis conducted on geographies consisting of 326,866,883 people shows a moderate positive correlation between the proportion of Immigrants from Peru and percentage of population with a disability between the ages 5 and 17 in the United States with a correlation coefficient (R) of 0.423 and weighted average of 5.3%. Similarly, the statistical analysis conducted on geographies consisting of 92,024,510 people shows no correlation between the proportion of Lumbee and percentage of population with a disability between the ages 5 and 17 in the United States with a correlation coefficient (R) of 0.000 and weighted average of 6.2%, a difference of 18.5%.
Disability Age 5 to 17 Correlation Summary
| Measurement | Immigrants from Peru | Lumbee |
| Minimum | 1.2% | 1.7% |
| Maximum | 47.8% | 20.0% |
| Range | 46.7% | 18.3% |
| Mean | 6.2% | 8.3% |
| Median | 5.1% | 6.5% |
| Interquartile 25% (IQ1) | 4.5% | 5.2% |
| Interquartile 75% (IQ3) | 6.3% | 9.3% |
| Interquartile Range (IQR) | 1.8% | 4.1% |
| Standard Deviation (Sample) | 5.5% | 4.8% |
| Standard Deviation (Population) | 5.4% | 4.7% |
Similar Demographics by Disability Age 5 to 17
Demographics Similar to Immigrants from Peru by Disability Age 5 to 17
In terms of disability age 5 to 17, the demographic groups most similar to Immigrants from Peru are Immigrants from Jordan (5.3%, a difference of 0.070%), Luxembourger (5.3%, a difference of 0.080%), Mongolian (5.3%, a difference of 0.090%), Immigrants from Grenada (5.3%, a difference of 0.090%), and Immigrants from El Salvador (5.3%, a difference of 0.25%).
| Demographics | Rating | Rank | Disability Age 5 to 17 |
| Immigrants | St. Vincent and the Grenadines | 99.4 /100 | #86 | Exceptional 5.2% |
| Eastern Europeans | 99.4 /100 | #87 | Exceptional 5.2% |
| Immigrants | Croatia | 99.4 /100 | #88 | Exceptional 5.2% |
| Immigrants | Spain | 99.4 /100 | #89 | Exceptional 5.2% |
| Immigrants | Kuwait | 99.4 /100 | #90 | Exceptional 5.3% |
| Mongolians | 99.2 /100 | #91 | Exceptional 5.3% |
| Luxembourgers | 99.2 /100 | #92 | Exceptional 5.3% |
| Immigrants | Peru | 99.1 /100 | #93 | Exceptional 5.3% |
| Immigrants | Jordan | 99.1 /100 | #94 | Exceptional 5.3% |
| Immigrants | Grenada | 99.1 /100 | #95 | Exceptional 5.3% |
| Immigrants | El Salvador | 99.0 /100 | #96 | Exceptional 5.3% |
| Immigrants | Europe | 99.0 /100 | #97 | Exceptional 5.3% |
| Immigrants | Austria | 98.9 /100 | #98 | Exceptional 5.3% |
| Cambodians | 98.8 /100 | #99 | Exceptional 5.3% |
| Nepalese | 98.7 /100 | #100 | Exceptional 5.3% |
Demographics Similar to Lumbee by Disability Age 5 to 17
In terms of disability age 5 to 17, the demographic groups most similar to Lumbee are Immigrants from Bahamas (6.2%, a difference of 0.070%), Welsh (6.3%, a difference of 0.15%), Spanish American (6.2%, a difference of 0.19%), Cree (6.2%, a difference of 0.22%), and Carpatho Rusyn (6.3%, a difference of 0.27%).
| Demographics | Rating | Rank | Disability Age 5 to 17 |
| Whites/Caucasians | 0.0 /100 | #291 | Tragic 6.2% |
| Immigrants | Senegal | 0.0 /100 | #292 | Tragic 6.2% |
| Central American Indians | 0.0 /100 | #293 | Tragic 6.2% |
| Irish | 0.0 /100 | #294 | Tragic 6.2% |
| Cree | 0.0 /100 | #295 | Tragic 6.2% |
| Spanish Americans | 0.0 /100 | #296 | Tragic 6.2% |
| Immigrants | Bahamas | 0.0 /100 | #297 | Tragic 6.2% |
| Lumbee | 0.0 /100 | #298 | Tragic 6.2% |
| Welsh | 0.0 /100 | #299 | Tragic 6.3% |
| Carpatho Rusyns | 0.0 /100 | #300 | Tragic 6.3% |
| U.S. Virgin Islanders | 0.0 /100 | #301 | Tragic 6.3% |
| Celtics | 0.0 /100 | #302 | Tragic 6.3% |
| Yakama | 0.0 /100 | #303 | Tragic 6.3% |
| Senegalese | 0.0 /100 | #304 | Tragic 6.3% |
| Natives/Alaskans | 0.0 /100 | #305 | Tragic 6.3% |