Pennsylvania German vs Lumbee Single Mother Households
COMPARE
Pennsylvania German
Lumbee
Single Mother Households
Single Mother Households Comparison
Pennsylvania Germans
Lumbee
5.8%
SINGLE MOTHER HOUSEHOLDS
94.7/ 100
METRIC RATING
116th/ 347
METRIC RANK
9.1%
SINGLE MOTHER HOUSEHOLDS
0.0/ 100
METRIC RATING
340th/ 347
METRIC RANK
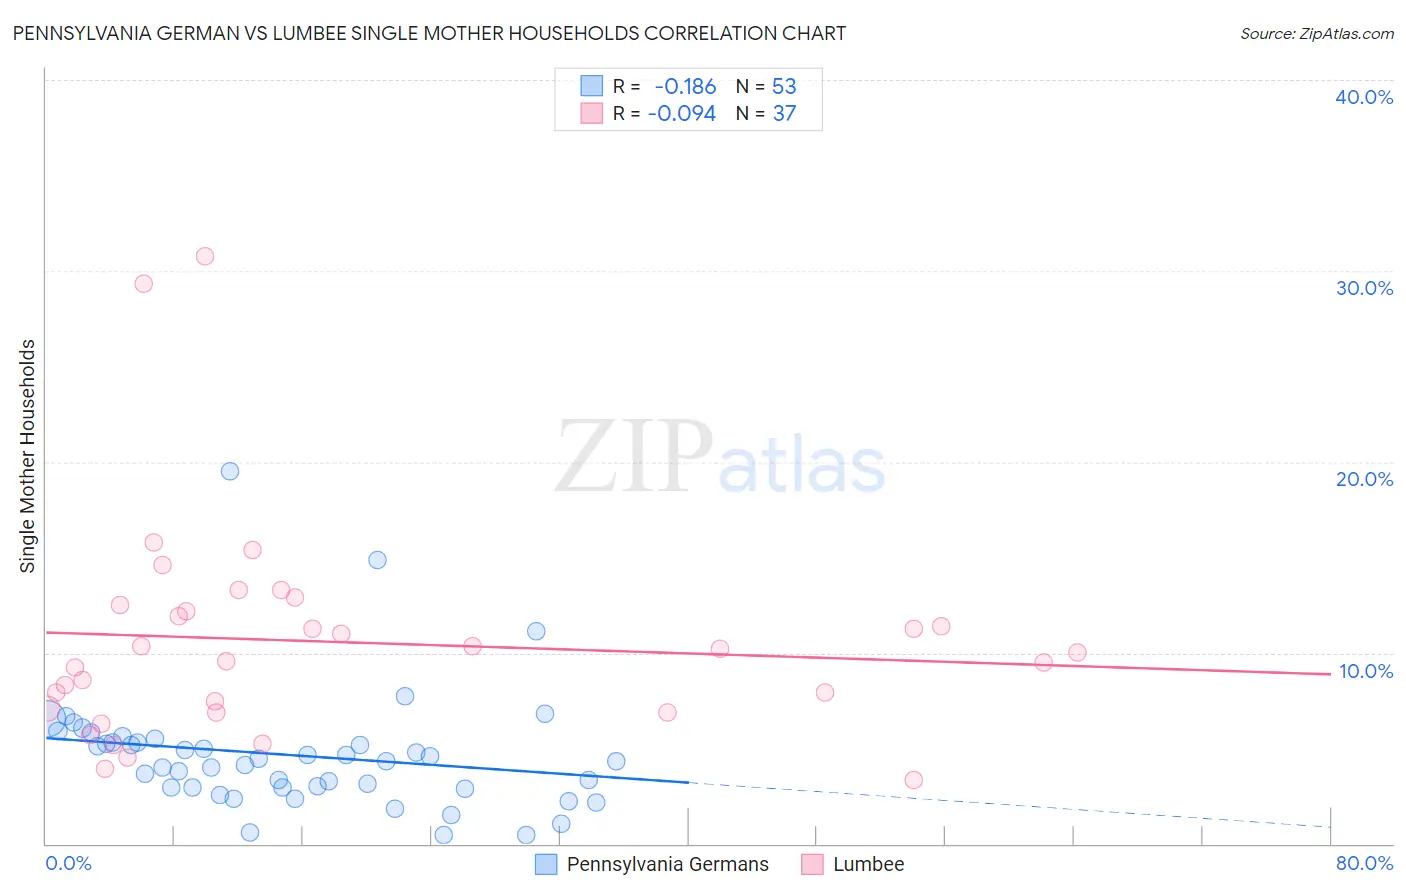
Pennsylvania German vs Lumbee Single Mother Households Correlation Chart
The statistical analysis conducted on geographies consisting of 233,304,325 people shows a poor negative correlation between the proportion of Pennsylvania Germans and percentage of single mother households in the United States with a correlation coefficient (R) of -0.186 and weighted average of 5.8%. Similarly, the statistical analysis conducted on geographies consisting of 92,236,041 people shows a slight negative correlation between the proportion of Lumbee and percentage of single mother households in the United States with a correlation coefficient (R) of -0.094 and weighted average of 9.1%, a difference of 56.6%.
Single Mother Households Correlation Summary
| Measurement | Pennsylvania German | Lumbee |
| Minimum | 0.44% | 3.3% |
| Maximum | 19.5% | 30.7% |
| Range | 19.0% | 27.4% |
| Mean | 4.6% | 10.6% |
| Median | 4.3% | 10.0% |
| Interquartile 25% (IQ1) | 2.9% | 7.0% |
| Interquartile 75% (IQ3) | 5.4% | 12.3% |
| Interquartile Range (IQR) | 2.5% | 5.3% |
| Standard Deviation (Sample) | 3.2% | 5.7% |
| Standard Deviation (Population) | 3.2% | 5.6% |
Similar Demographics by Single Mother Households
Demographics Similar to Pennsylvania Germans by Single Mother Households
In terms of single mother households, the demographic groups most similar to Pennsylvania Germans are Irish (5.8%, a difference of 0.070%), Bolivian (5.8%, a difference of 0.070%), Dutch (5.8%, a difference of 0.25%), Laotian (5.8%, a difference of 0.25%), and South African (5.8%, a difference of 0.36%).
| Demographics | Rating | Rank | Single Mother Households |
| Immigrants | Western Europe | 95.7 /100 | #109 | Exceptional 5.8% |
| British | 95.5 /100 | #110 | Exceptional 5.8% |
| Immigrants | England | 95.5 /100 | #111 | Exceptional 5.8% |
| Immigrants | Kuwait | 95.4 /100 | #112 | Exceptional 5.8% |
| Mongolians | 95.3 /100 | #113 | Exceptional 5.8% |
| Dutch | 95.1 /100 | #114 | Exceptional 5.8% |
| Irish | 94.8 /100 | #115 | Exceptional 5.8% |
| Pennsylvania Germans | 94.7 /100 | #116 | Exceptional 5.8% |
| Bolivians | 94.6 /100 | #117 | Exceptional 5.8% |
| Laotians | 94.3 /100 | #118 | Exceptional 5.8% |
| South Africans | 94.1 /100 | #119 | Exceptional 5.8% |
| Tongans | 93.7 /100 | #120 | Exceptional 5.8% |
| Argentineans | 93.7 /100 | #121 | Exceptional 5.8% |
| Belgians | 93.5 /100 | #122 | Exceptional 5.8% |
| Immigrants | Uzbekistan | 93.4 /100 | #123 | Exceptional 5.9% |
Demographics Similar to Lumbee by Single Mother Households
In terms of single mother households, the demographic groups most similar to Lumbee are Tohono O'odham (9.1%, a difference of 0.36%), Menominee (9.2%, a difference of 0.68%), Dominican (9.2%, a difference of 0.89%), Black/African American (9.0%, a difference of 1.2%), and Cape Verdean (8.9%, a difference of 2.8%).
| Demographics | Rating | Rank | Single Mother Households |
| Liberians | 0.0 /100 | #333 | Tragic 8.6% |
| Immigrants | Liberia | 0.0 /100 | #334 | Tragic 8.7% |
| Immigrants | Dominica | 0.0 /100 | #335 | Tragic 8.7% |
| Puerto Ricans | 0.0 /100 | #336 | Tragic 8.7% |
| Navajo | 0.0 /100 | #337 | Tragic 8.8% |
| Cape Verdeans | 0.0 /100 | #338 | Tragic 8.9% |
| Blacks/African Americans | 0.0 /100 | #339 | Tragic 9.0% |
| Lumbee | 0.0 /100 | #340 | Tragic 9.1% |
| Tohono O'odham | 0.0 /100 | #341 | Tragic 9.1% |
| Menominee | 0.0 /100 | #342 | Tragic 9.2% |
| Dominicans | 0.0 /100 | #343 | Tragic 9.2% |
| Immigrants | Dominican Republic | 0.0 /100 | #344 | Tragic 9.5% |
| Immigrants | Cabo Verde | 0.0 /100 | #345 | Tragic 9.6% |
| Yuman | 0.0 /100 | #346 | Tragic 9.6% |
| Yup'ik | 0.0 /100 | #347 | Tragic 10.0% |