Immigrants from Serbia vs Lumbee Disability Age 5 to 17
COMPARE
Immigrants from Serbia
Lumbee
Disability Age 5 to 17
Disability Age 5 to 17 Comparison
Immigrants from Serbia
Lumbee
4.9%
DISABILITY AGE 5 TO 17
100.0/ 100
METRIC RATING
29th/ 347
METRIC RANK
6.2%
DISABILITY AGE 5 TO 17
0.0/ 100
METRIC RATING
298th/ 347
METRIC RANK
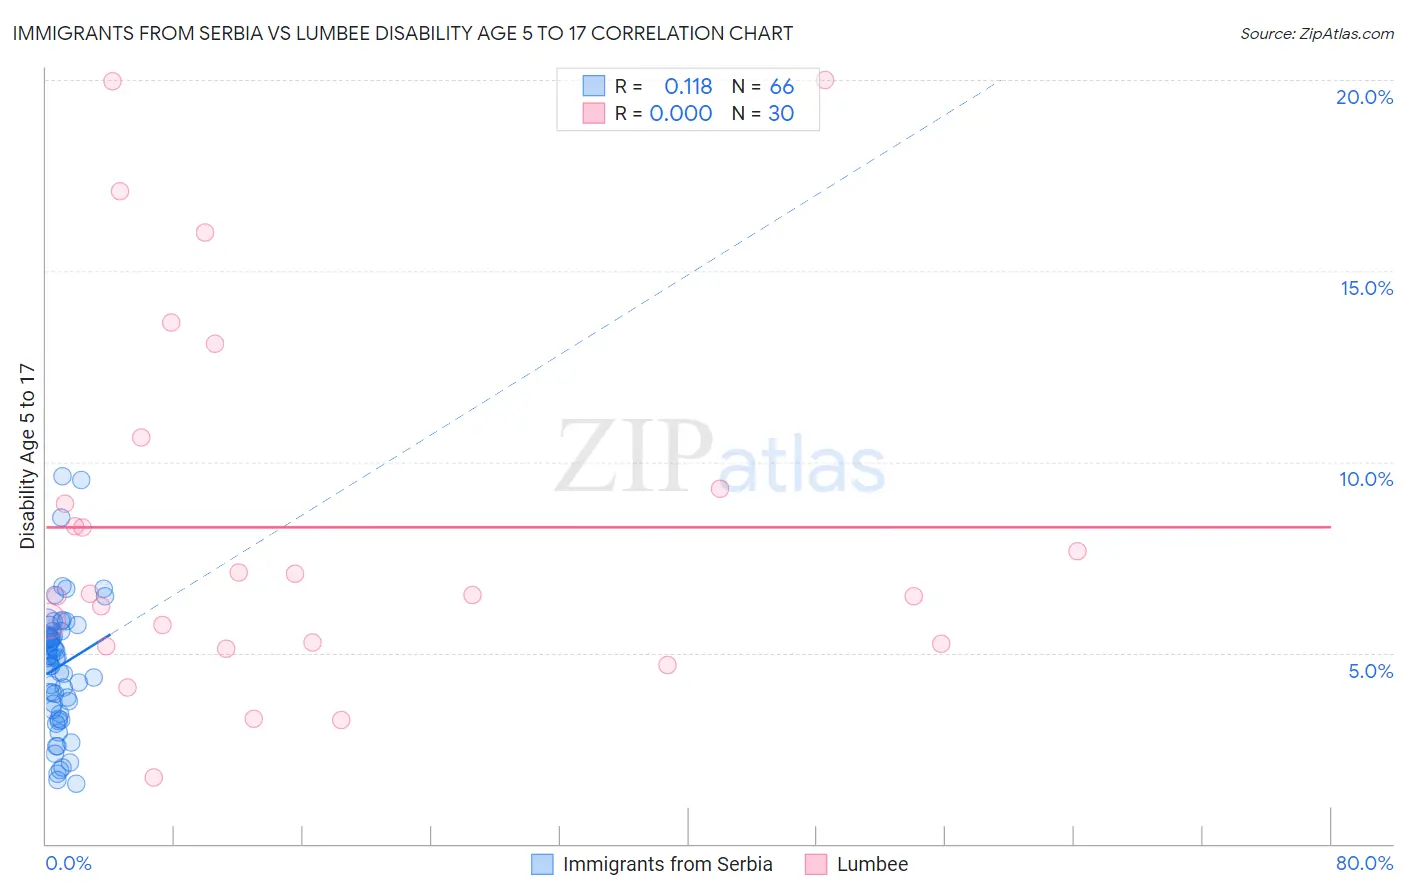
Immigrants from Serbia vs Lumbee Disability Age 5 to 17 Correlation Chart
The statistical analysis conducted on geographies consisting of 131,235,247 people shows a poor positive correlation between the proportion of Immigrants from Serbia and percentage of population with a disability between the ages 5 and 17 in the United States with a correlation coefficient (R) of 0.118 and weighted average of 4.9%. Similarly, the statistical analysis conducted on geographies consisting of 92,024,510 people shows no correlation between the proportion of Lumbee and percentage of population with a disability between the ages 5 and 17 in the United States with a correlation coefficient (R) of 0.000 and weighted average of 6.2%, a difference of 26.3%.
Disability Age 5 to 17 Correlation Summary
| Measurement | Immigrants from Serbia | Lumbee |
| Minimum | 1.6% | 1.7% |
| Maximum | 9.6% | 20.0% |
| Range | 8.0% | 18.3% |
| Mean | 4.7% | 8.3% |
| Median | 4.9% | 6.5% |
| Interquartile 25% (IQ1) | 3.5% | 5.2% |
| Interquartile 75% (IQ3) | 5.6% | 9.3% |
| Interquartile Range (IQR) | 2.1% | 4.1% |
| Standard Deviation (Sample) | 1.7% | 4.8% |
| Standard Deviation (Population) | 1.7% | 4.7% |
Similar Demographics by Disability Age 5 to 17
Demographics Similar to Immigrants from Serbia by Disability Age 5 to 17
In terms of disability age 5 to 17, the demographic groups most similar to Immigrants from Serbia are Immigrants from Malaysia (5.0%, a difference of 0.22%), Immigrants from Pakistan (5.0%, a difference of 0.47%), Immigrants from Japan (4.9%, a difference of 0.48%), Soviet Union (5.0%, a difference of 0.51%), and Taiwanese (4.9%, a difference of 0.56%).
| Demographics | Rating | Rank | Disability Age 5 to 17 |
| Asians | 100.0 /100 | #22 | Exceptional 4.8% |
| Immigrants | Bolivia | 100.0 /100 | #23 | Exceptional 4.8% |
| Immigrants | Lebanon | 100.0 /100 | #24 | Exceptional 4.8% |
| Immigrants | Asia | 100.0 /100 | #25 | Exceptional 4.8% |
| Bhutanese | 100.0 /100 | #26 | Exceptional 4.9% |
| Taiwanese | 100.0 /100 | #27 | Exceptional 4.9% |
| Immigrants | Japan | 100.0 /100 | #28 | Exceptional 4.9% |
| Immigrants | Serbia | 100.0 /100 | #29 | Exceptional 4.9% |
| Immigrants | Malaysia | 100.0 /100 | #30 | Exceptional 5.0% |
| Immigrants | Pakistan | 100.0 /100 | #31 | Exceptional 5.0% |
| Soviet Union | 100.0 /100 | #32 | Exceptional 5.0% |
| Immigrants | Indonesia | 100.0 /100 | #33 | Exceptional 5.0% |
| Israelis | 100.0 /100 | #34 | Exceptional 5.0% |
| Bolivians | 100.0 /100 | #35 | Exceptional 5.0% |
| Immigrants | Egypt | 100.0 /100 | #36 | Exceptional 5.0% |
Demographics Similar to Lumbee by Disability Age 5 to 17
In terms of disability age 5 to 17, the demographic groups most similar to Lumbee are Immigrants from Bahamas (6.2%, a difference of 0.070%), Welsh (6.3%, a difference of 0.15%), Spanish American (6.2%, a difference of 0.19%), Cree (6.2%, a difference of 0.22%), and Carpatho Rusyn (6.3%, a difference of 0.27%).
| Demographics | Rating | Rank | Disability Age 5 to 17 |
| Whites/Caucasians | 0.0 /100 | #291 | Tragic 6.2% |
| Immigrants | Senegal | 0.0 /100 | #292 | Tragic 6.2% |
| Central American Indians | 0.0 /100 | #293 | Tragic 6.2% |
| Irish | 0.0 /100 | #294 | Tragic 6.2% |
| Cree | 0.0 /100 | #295 | Tragic 6.2% |
| Spanish Americans | 0.0 /100 | #296 | Tragic 6.2% |
| Immigrants | Bahamas | 0.0 /100 | #297 | Tragic 6.2% |
| Lumbee | 0.0 /100 | #298 | Tragic 6.2% |
| Welsh | 0.0 /100 | #299 | Tragic 6.3% |
| Carpatho Rusyns | 0.0 /100 | #300 | Tragic 6.3% |
| U.S. Virgin Islanders | 0.0 /100 | #301 | Tragic 6.3% |
| Celtics | 0.0 /100 | #302 | Tragic 6.3% |
| Yakama | 0.0 /100 | #303 | Tragic 6.3% |
| Senegalese | 0.0 /100 | #304 | Tragic 6.3% |
| Natives/Alaskans | 0.0 /100 | #305 | Tragic 6.3% |