Palestinian vs Macedonian Disability
COMPARE
Palestinian
Macedonian
Disability
Disability Comparison
Palestinians
Macedonians
11.1%
DISABILITY
98.9/ 100
METRIC RATING
87th/ 347
METRIC RANK
11.4%
DISABILITY
90.3/ 100
METRIC RATING
129th/ 347
METRIC RANK
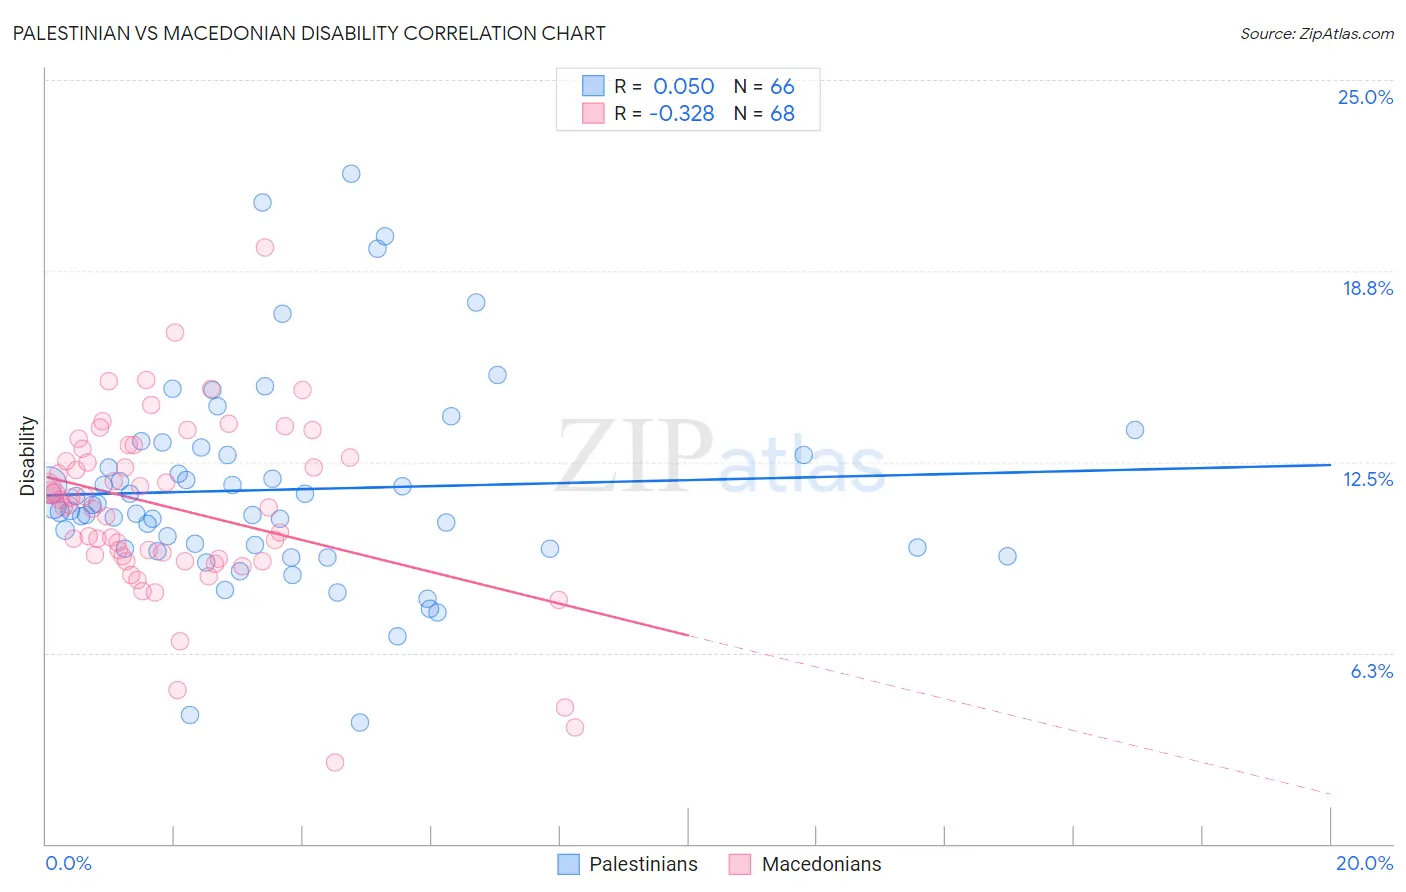
Palestinian vs Macedonian Disability Correlation Chart
The statistical analysis conducted on geographies consisting of 216,463,663 people shows no correlation between the proportion of Palestinians and percentage of population with a disability in the United States with a correlation coefficient (R) of 0.050 and weighted average of 11.1%. Similarly, the statistical analysis conducted on geographies consisting of 132,658,992 people shows a mild negative correlation between the proportion of Macedonians and percentage of population with a disability in the United States with a correlation coefficient (R) of -0.328 and weighted average of 11.4%, a difference of 2.6%.
Disability Correlation Summary
| Measurement | Palestinian | Macedonian |
| Minimum | 4.0% | 2.7% |
| Maximum | 21.9% | 19.5% |
| Range | 18.0% | 16.8% |
| Mean | 11.6% | 11.0% |
| Median | 11.0% | 11.2% |
| Interquartile 25% (IQ1) | 9.7% | 9.4% |
| Interquartile 75% (IQ3) | 12.7% | 12.8% |
| Interquartile Range (IQR) | 3.1% | 3.4% |
| Standard Deviation (Sample) | 3.4% | 2.9% |
| Standard Deviation (Population) | 3.4% | 2.9% |
Similar Demographics by Disability
Demographics Similar to Palestinians by Disability
In terms of disability, the demographic groups most similar to Palestinians are Immigrants from Belarus (11.1%, a difference of 0.040%), Immigrants from Russia (11.1%, a difference of 0.040%), Immigrants from Sierra Leone (11.1%, a difference of 0.19%), Immigrants from Switzerland (11.1%, a difference of 0.20%), and Chilean (11.1%, a difference of 0.23%).
| Demographics | Rating | Rank | Disability |
| Immigrants | Ireland | 99.3 /100 | #80 | Exceptional 11.1% |
| Immigrants | Poland | 99.1 /100 | #81 | Exceptional 11.1% |
| Chileans | 99.1 /100 | #82 | Exceptional 11.1% |
| Immigrants | Switzerland | 99.0 /100 | #83 | Exceptional 11.1% |
| Immigrants | Sierra Leone | 99.0 /100 | #84 | Exceptional 11.1% |
| Immigrants | Belarus | 98.9 /100 | #85 | Exceptional 11.1% |
| Immigrants | Russia | 98.9 /100 | #86 | Exceptional 11.1% |
| Palestinians | 98.9 /100 | #87 | Exceptional 11.1% |
| Immigrants | Romania | 98.5 /100 | #88 | Exceptional 11.2% |
| Immigrants | South Africa | 98.2 /100 | #89 | Exceptional 11.2% |
| Immigrants | Brazil | 98.1 /100 | #90 | Exceptional 11.2% |
| Immigrants | Western Asia | 98.1 /100 | #91 | Exceptional 11.2% |
| Ecuadorians | 98.0 /100 | #92 | Exceptional 11.2% |
| Immigrants | Ecuador | 98.0 /100 | #93 | Exceptional 11.2% |
| Immigrants | Morocco | 97.8 /100 | #94 | Exceptional 11.2% |
Demographics Similar to Macedonians by Disability
In terms of disability, the demographic groups most similar to Macedonians are Immigrants from Europe (11.4%, a difference of 0.010%), Immigrants from Italy (11.4%, a difference of 0.020%), Latvian (11.4%, a difference of 0.060%), Immigrants from Croatia (11.4%, a difference of 0.060%), and Immigrants from Latvia (11.4%, a difference of 0.080%).
| Demographics | Rating | Rank | Disability |
| Brazilians | 93.3 /100 | #122 | Exceptional 11.4% |
| South Africans | 92.3 /100 | #123 | Exceptional 11.4% |
| South American Indians | 92.2 /100 | #124 | Exceptional 11.4% |
| Costa Ricans | 91.9 /100 | #125 | Exceptional 11.4% |
| Immigrants | Latvia | 90.9 /100 | #126 | Exceptional 11.4% |
| Immigrants | Italy | 90.4 /100 | #127 | Exceptional 11.4% |
| Immigrants | Europe | 90.4 /100 | #128 | Exceptional 11.4% |
| Macedonians | 90.3 /100 | #129 | Exceptional 11.4% |
| Latvians | 89.8 /100 | #130 | Excellent 11.4% |
| Immigrants | Croatia | 89.8 /100 | #131 | Excellent 11.4% |
| Immigrants | Africa | 89.3 /100 | #132 | Excellent 11.4% |
| Arabs | 89.1 /100 | #133 | Excellent 11.4% |
| Immigrants | Guyana | 88.3 /100 | #134 | Excellent 11.4% |
| Ugandans | 87.9 /100 | #135 | Excellent 11.4% |
| Immigrants | St. Vincent and the Grenadines | 87.8 /100 | #136 | Excellent 11.4% |