Palestinian vs Immigrants from Hong Kong Disability
COMPARE
Palestinian
Immigrants from Hong Kong
Disability
Disability Comparison
Palestinians
Immigrants from Hong Kong
11.1%
DISABILITY
98.9/ 100
METRIC RATING
87th/ 347
METRIC RANK
10.0%
DISABILITY
100.0/ 100
METRIC RATING
9th/ 347
METRIC RANK
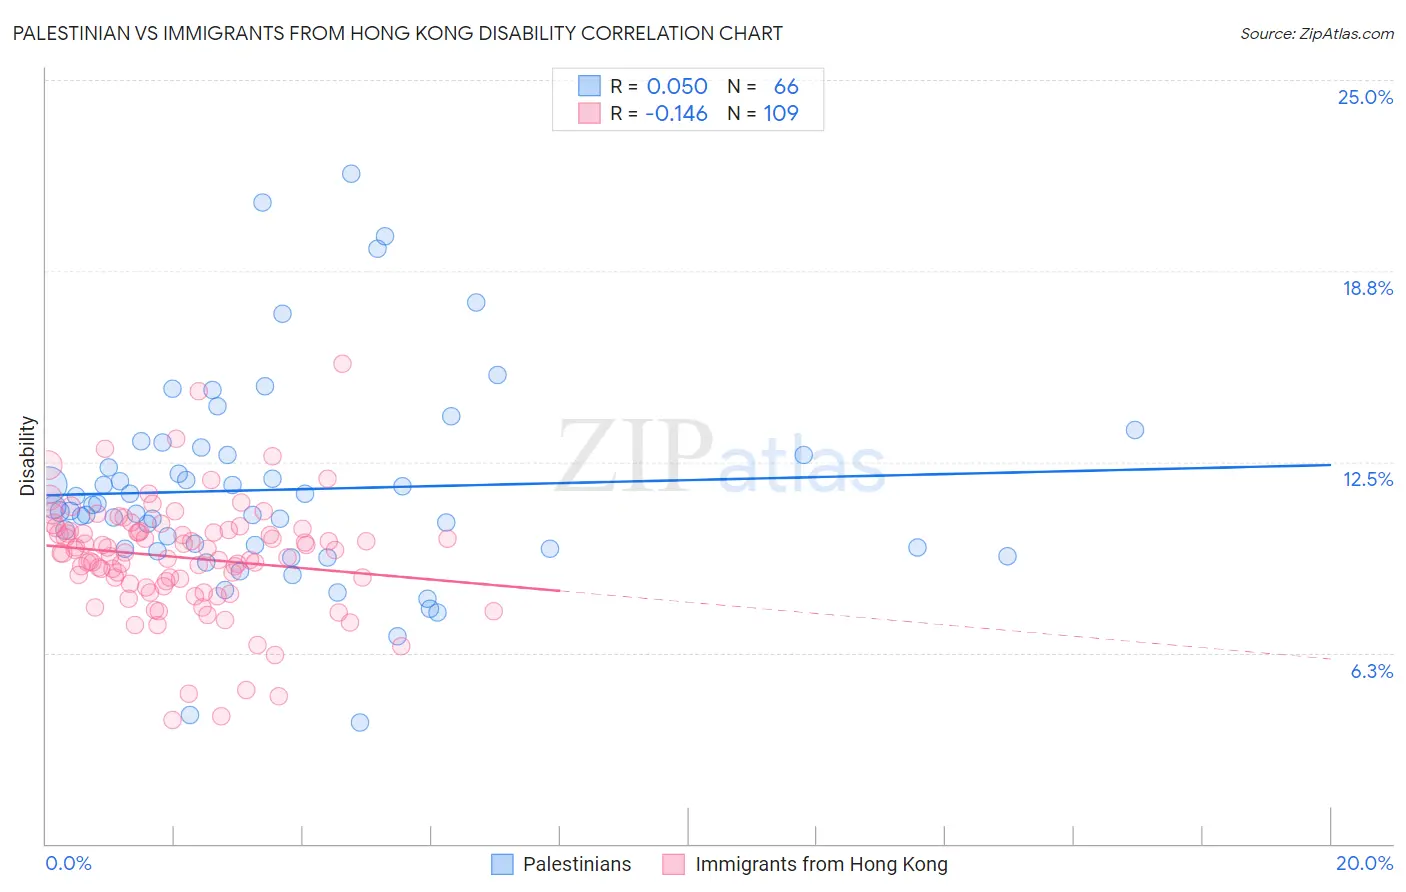
Palestinian vs Immigrants from Hong Kong Disability Correlation Chart
The statistical analysis conducted on geographies consisting of 216,463,663 people shows no correlation between the proportion of Palestinians and percentage of population with a disability in the United States with a correlation coefficient (R) of 0.050 and weighted average of 11.1%. Similarly, the statistical analysis conducted on geographies consisting of 253,995,136 people shows a poor negative correlation between the proportion of Immigrants from Hong Kong and percentage of population with a disability in the United States with a correlation coefficient (R) of -0.146 and weighted average of 10.0%, a difference of 10.9%.
Disability Correlation Summary
| Measurement | Palestinian | Immigrants from Hong Kong |
| Minimum | 4.0% | 4.0% |
| Maximum | 21.9% | 15.7% |
| Range | 18.0% | 11.7% |
| Mean | 11.6% | 9.4% |
| Median | 11.0% | 9.5% |
| Interquartile 25% (IQ1) | 9.7% | 8.5% |
| Interquartile 75% (IQ3) | 12.7% | 10.2% |
| Interquartile Range (IQR) | 3.1% | 1.8% |
| Standard Deviation (Sample) | 3.4% | 1.9% |
| Standard Deviation (Population) | 3.4% | 1.9% |
Similar Demographics by Disability
Demographics Similar to Palestinians by Disability
In terms of disability, the demographic groups most similar to Palestinians are Immigrants from Belarus (11.1%, a difference of 0.040%), Immigrants from Russia (11.1%, a difference of 0.040%), Immigrants from Sierra Leone (11.1%, a difference of 0.19%), Immigrants from Switzerland (11.1%, a difference of 0.20%), and Chilean (11.1%, a difference of 0.23%).
| Demographics | Rating | Rank | Disability |
| Immigrants | Ireland | 99.3 /100 | #80 | Exceptional 11.1% |
| Immigrants | Poland | 99.1 /100 | #81 | Exceptional 11.1% |
| Chileans | 99.1 /100 | #82 | Exceptional 11.1% |
| Immigrants | Switzerland | 99.0 /100 | #83 | Exceptional 11.1% |
| Immigrants | Sierra Leone | 99.0 /100 | #84 | Exceptional 11.1% |
| Immigrants | Belarus | 98.9 /100 | #85 | Exceptional 11.1% |
| Immigrants | Russia | 98.9 /100 | #86 | Exceptional 11.1% |
| Palestinians | 98.9 /100 | #87 | Exceptional 11.1% |
| Immigrants | Romania | 98.5 /100 | #88 | Exceptional 11.2% |
| Immigrants | South Africa | 98.2 /100 | #89 | Exceptional 11.2% |
| Immigrants | Brazil | 98.1 /100 | #90 | Exceptional 11.2% |
| Immigrants | Western Asia | 98.1 /100 | #91 | Exceptional 11.2% |
| Ecuadorians | 98.0 /100 | #92 | Exceptional 11.2% |
| Immigrants | Ecuador | 98.0 /100 | #93 | Exceptional 11.2% |
| Immigrants | Morocco | 97.8 /100 | #94 | Exceptional 11.2% |
Demographics Similar to Immigrants from Hong Kong by Disability
In terms of disability, the demographic groups most similar to Immigrants from Hong Kong are Bolivian (10.0%, a difference of 0.30%), Immigrants from Singapore (10.0%, a difference of 0.52%), Immigrants from China (10.1%, a difference of 0.81%), Iranian (10.1%, a difference of 0.82%), and Immigrants from South Central Asia (9.9%, a difference of 0.84%).
| Demographics | Rating | Rank | Disability |
| Filipinos | 100.0 /100 | #2 | Exceptional 9.6% |
| Immigrants | Taiwan | 100.0 /100 | #3 | Exceptional 9.6% |
| Thais | 100.0 /100 | #4 | Exceptional 9.7% |
| Immigrants | Bolivia | 100.0 /100 | #5 | Exceptional 9.9% |
| Immigrants | South Central Asia | 100.0 /100 | #6 | Exceptional 9.9% |
| Immigrants | Singapore | 100.0 /100 | #7 | Exceptional 10.0% |
| Bolivians | 100.0 /100 | #8 | Exceptional 10.0% |
| Immigrants | Hong Kong | 100.0 /100 | #9 | Exceptional 10.0% |
| Immigrants | China | 100.0 /100 | #10 | Exceptional 10.1% |
| Iranians | 100.0 /100 | #11 | Exceptional 10.1% |
| Immigrants | Israel | 100.0 /100 | #12 | Exceptional 10.1% |
| Immigrants | Eastern Asia | 100.0 /100 | #13 | Exceptional 10.2% |
| Immigrants | Korea | 100.0 /100 | #14 | Exceptional 10.2% |
| Okinawans | 100.0 /100 | #15 | Exceptional 10.3% |
| Indians (Asian) | 100.0 /100 | #16 | Exceptional 10.3% |