Immigrants from South Eastern Asia vs Macedonian Disability
COMPARE
Immigrants from South Eastern Asia
Macedonian
Disability
Disability Comparison
Immigrants from South Eastern Asia
Macedonians
11.3%
DISABILITY
95.4/ 100
METRIC RATING
111th/ 347
METRIC RANK
11.4%
DISABILITY
90.3/ 100
METRIC RATING
129th/ 347
METRIC RANK
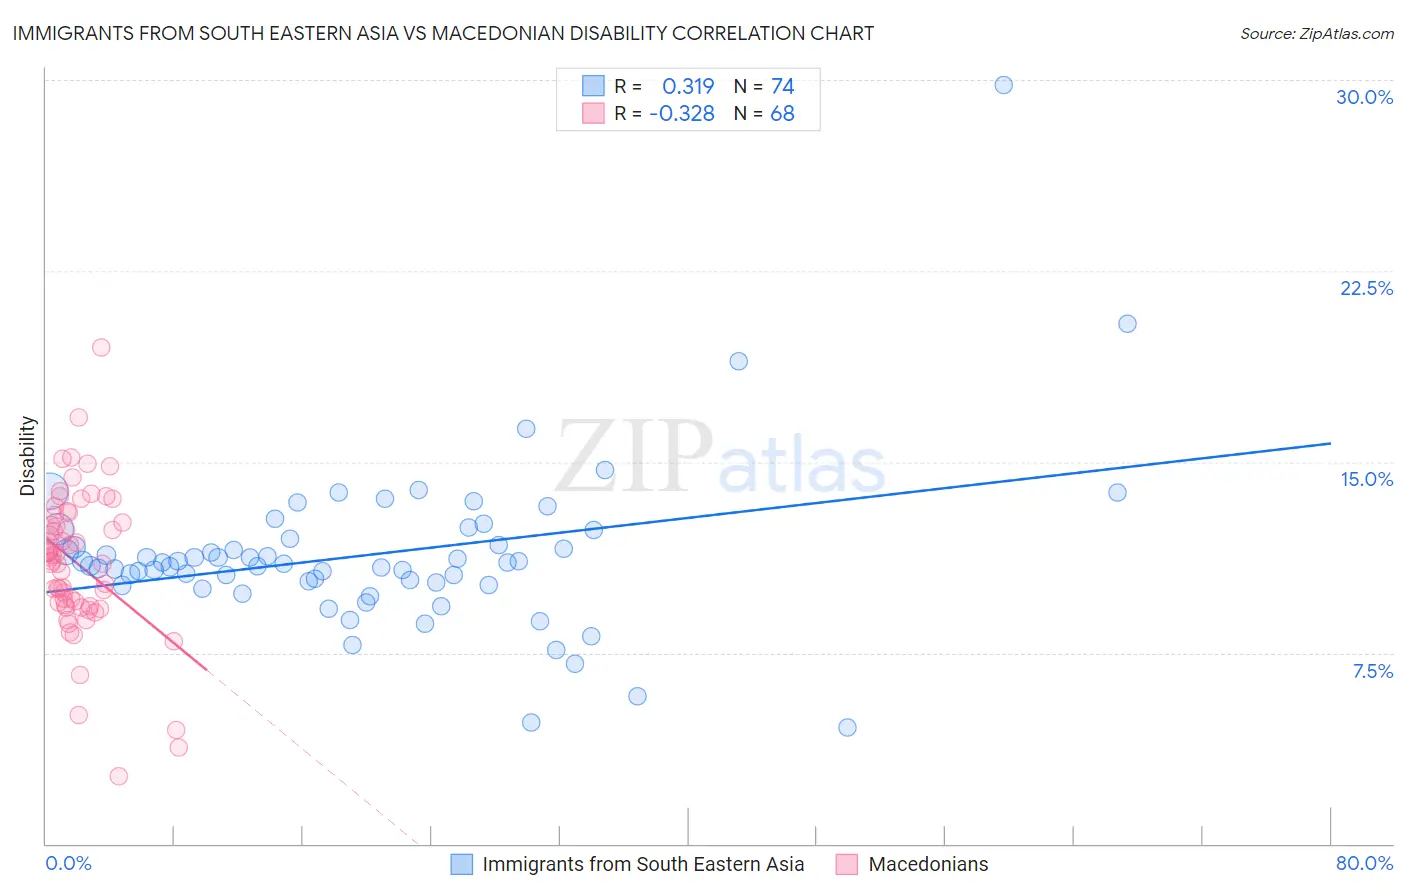
Immigrants from South Eastern Asia vs Macedonian Disability Correlation Chart
The statistical analysis conducted on geographies consisting of 512,586,724 people shows a mild positive correlation between the proportion of Immigrants from South Eastern Asia and percentage of population with a disability in the United States with a correlation coefficient (R) of 0.319 and weighted average of 11.3%. Similarly, the statistical analysis conducted on geographies consisting of 132,658,992 people shows a mild negative correlation between the proportion of Macedonians and percentage of population with a disability in the United States with a correlation coefficient (R) of -0.328 and weighted average of 11.4%, a difference of 0.92%.
Disability Correlation Summary
| Measurement | Immigrants from South Eastern Asia | Macedonian |
| Minimum | 4.6% | 2.7% |
| Maximum | 29.8% | 19.5% |
| Range | 25.2% | 16.8% |
| Mean | 11.4% | 11.0% |
| Median | 11.0% | 11.2% |
| Interquartile 25% (IQ1) | 10.3% | 9.4% |
| Interquartile 75% (IQ3) | 12.0% | 12.8% |
| Interquartile Range (IQR) | 1.7% | 3.4% |
| Standard Deviation (Sample) | 3.3% | 2.9% |
| Standard Deviation (Population) | 3.3% | 2.9% |
Demographics Similar to Immigrants from South Eastern Asia and Macedonians by Disability
In terms of disability, the demographic groups most similar to Immigrants from South Eastern Asia are Immigrants from Denmark (11.3%, a difference of 0.070%), Immigrants from Uzbekistan (11.3%, a difference of 0.12%), Guyanese (11.3%, a difference of 0.16%), Immigrants from Syria (11.3%, a difference of 0.17%), and Immigrants from Philippines (11.3%, a difference of 0.18%). Similarly, the demographic groups most similar to Macedonians are Immigrants from Europe (11.4%, a difference of 0.010%), Immigrants from Italy (11.4%, a difference of 0.020%), Latvian (11.4%, a difference of 0.060%), Immigrants from Latvia (11.4%, a difference of 0.080%), and Costa Rican (11.4%, a difference of 0.24%).
| Demographics | Rating | Rank | Disability |
| Immigrants | Denmark | 95.6 /100 | #110 | Exceptional 11.3% |
| Immigrants | South Eastern Asia | 95.4 /100 | #111 | Exceptional 11.3% |
| Immigrants | Uzbekistan | 94.9 /100 | #112 | Exceptional 11.3% |
| Guyanese | 94.7 /100 | #113 | Exceptional 11.3% |
| Immigrants | Syria | 94.7 /100 | #114 | Exceptional 11.3% |
| Immigrants | Philippines | 94.6 /100 | #115 | Exceptional 11.3% |
| Immigrants | Northern Europe | 94.1 /100 | #116 | Exceptional 11.3% |
| Luxembourgers | 93.9 /100 | #117 | Exceptional 11.3% |
| Koreans | 93.8 /100 | #118 | Exceptional 11.3% |
| Central Americans | 93.5 /100 | #119 | Exceptional 11.4% |
| Immigrants | North Macedonia | 93.5 /100 | #120 | Exceptional 11.4% |
| Immigrants | Costa Rica | 93.4 /100 | #121 | Exceptional 11.4% |
| Brazilians | 93.3 /100 | #122 | Exceptional 11.4% |
| South Africans | 92.3 /100 | #123 | Exceptional 11.4% |
| South American Indians | 92.2 /100 | #124 | Exceptional 11.4% |
| Costa Ricans | 91.9 /100 | #125 | Exceptional 11.4% |
| Immigrants | Latvia | 90.9 /100 | #126 | Exceptional 11.4% |
| Immigrants | Italy | 90.4 /100 | #127 | Exceptional 11.4% |
| Immigrants | Europe | 90.4 /100 | #128 | Exceptional 11.4% |
| Macedonians | 90.3 /100 | #129 | Exceptional 11.4% |
| Latvians | 89.8 /100 | #130 | Excellent 11.4% |