Immigrants from Fiji vs Macedonian Disability
COMPARE
Immigrants from Fiji
Macedonian
Disability
Disability Comparison
Immigrants from Fiji
Macedonians
11.6%
DISABILITY
69.5/ 100
METRIC RATING
156th/ 347
METRIC RANK
11.4%
DISABILITY
90.3/ 100
METRIC RATING
129th/ 347
METRIC RANK
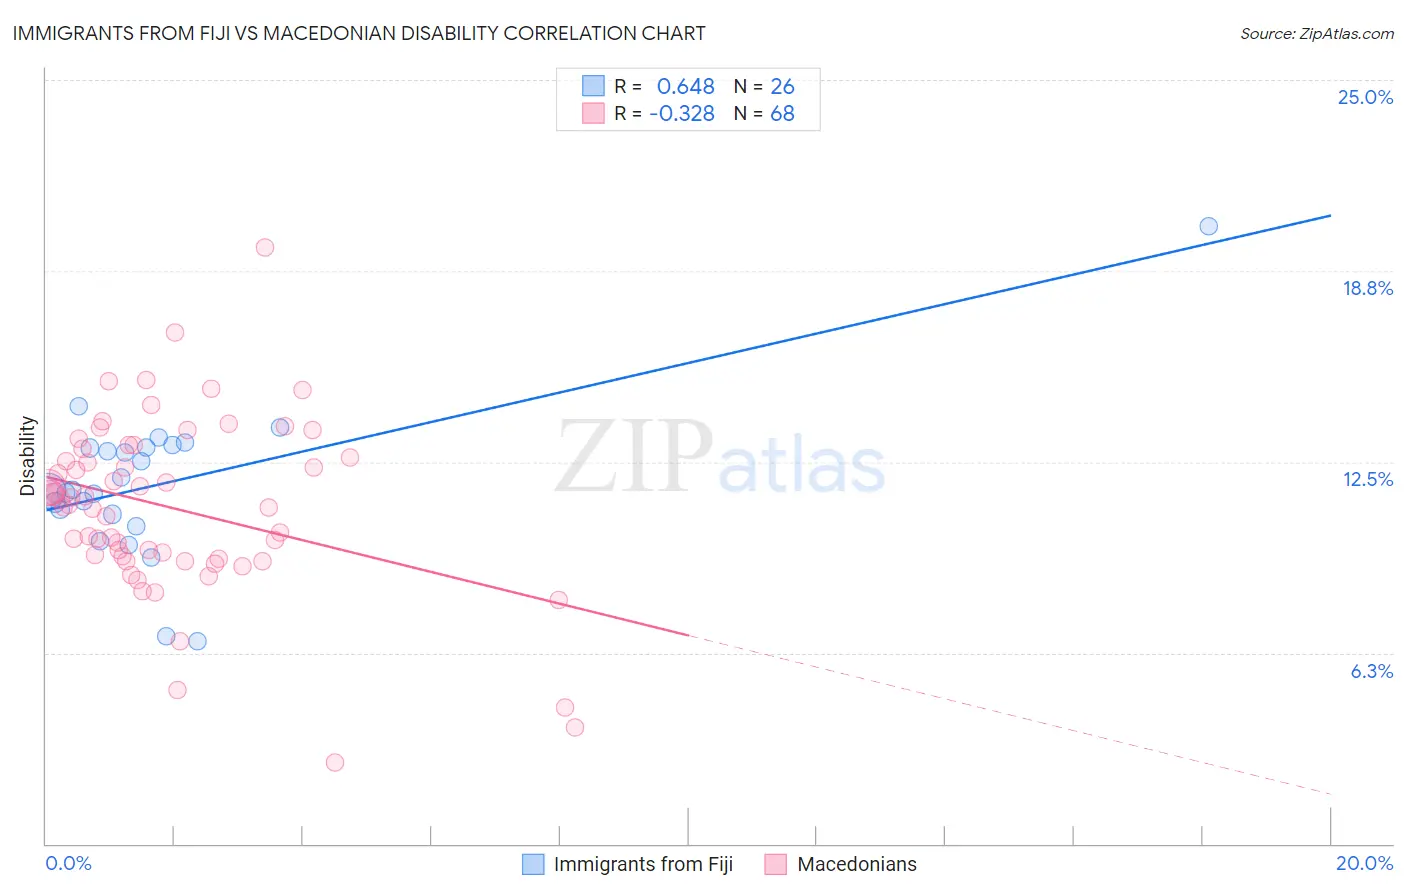
Immigrants from Fiji vs Macedonian Disability Correlation Chart
The statistical analysis conducted on geographies consisting of 93,755,847 people shows a significant positive correlation between the proportion of Immigrants from Fiji and percentage of population with a disability in the United States with a correlation coefficient (R) of 0.648 and weighted average of 11.6%. Similarly, the statistical analysis conducted on geographies consisting of 132,658,992 people shows a mild negative correlation between the proportion of Macedonians and percentage of population with a disability in the United States with a correlation coefficient (R) of -0.328 and weighted average of 11.4%, a difference of 1.6%.
Disability Correlation Summary
| Measurement | Immigrants from Fiji | Macedonian |
| Minimum | 6.6% | 2.7% |
| Maximum | 20.2% | 19.5% |
| Range | 13.6% | 16.8% |
| Mean | 11.8% | 11.0% |
| Median | 11.6% | 11.2% |
| Interquartile 25% (IQ1) | 10.8% | 9.4% |
| Interquartile 75% (IQ3) | 13.0% | 12.8% |
| Interquartile Range (IQR) | 2.2% | 3.4% |
| Standard Deviation (Sample) | 2.5% | 2.9% |
| Standard Deviation (Population) | 2.5% | 2.9% |
Similar Demographics by Disability
Demographics Similar to Immigrants from Fiji by Disability
In terms of disability, the demographic groups most similar to Immigrants from Fiji are Immigrants from Middle Africa (11.6%, a difference of 0.0%), Immigrants from Netherlands (11.6%, a difference of 0.010%), Immigrants from Ghana (11.6%, a difference of 0.090%), Immigrants from Guatemala (11.6%, a difference of 0.090%), and Immigrants from Kenya (11.6%, a difference of 0.14%).
| Demographics | Rating | Rank | Disability |
| Immigrants | Norway | 73.2 /100 | #149 | Good 11.6% |
| Romanians | 72.7 /100 | #150 | Good 11.6% |
| Immigrants | Kenya | 72.1 /100 | #151 | Good 11.6% |
| Immigrants | Moldova | 72.0 /100 | #152 | Good 11.6% |
| Immigrants | Ghana | 71.2 /100 | #153 | Good 11.6% |
| Immigrants | Guatemala | 71.1 /100 | #154 | Good 11.6% |
| Immigrants | Netherlands | 69.8 /100 | #155 | Good 11.6% |
| Immigrants | Fiji | 69.5 /100 | #156 | Good 11.6% |
| Immigrants | Middle Africa | 69.5 /100 | #157 | Good 11.6% |
| Armenians | 65.9 /100 | #158 | Good 11.6% |
| Guatemalans | 65.1 /100 | #159 | Good 11.6% |
| Immigrants | Barbados | 64.2 /100 | #160 | Good 11.6% |
| Immigrants | Cuba | 62.8 /100 | #161 | Good 11.6% |
| Immigrants | Haiti | 59.2 /100 | #162 | Average 11.7% |
| Immigrants | Trinidad and Tobago | 58.9 /100 | #163 | Average 11.7% |
Demographics Similar to Macedonians by Disability
In terms of disability, the demographic groups most similar to Macedonians are Immigrants from Europe (11.4%, a difference of 0.010%), Immigrants from Italy (11.4%, a difference of 0.020%), Latvian (11.4%, a difference of 0.060%), Immigrants from Croatia (11.4%, a difference of 0.060%), and Immigrants from Latvia (11.4%, a difference of 0.080%).
| Demographics | Rating | Rank | Disability |
| Brazilians | 93.3 /100 | #122 | Exceptional 11.4% |
| South Africans | 92.3 /100 | #123 | Exceptional 11.4% |
| South American Indians | 92.2 /100 | #124 | Exceptional 11.4% |
| Costa Ricans | 91.9 /100 | #125 | Exceptional 11.4% |
| Immigrants | Latvia | 90.9 /100 | #126 | Exceptional 11.4% |
| Immigrants | Italy | 90.4 /100 | #127 | Exceptional 11.4% |
| Immigrants | Europe | 90.4 /100 | #128 | Exceptional 11.4% |
| Macedonians | 90.3 /100 | #129 | Exceptional 11.4% |
| Latvians | 89.8 /100 | #130 | Excellent 11.4% |
| Immigrants | Croatia | 89.8 /100 | #131 | Excellent 11.4% |
| Immigrants | Africa | 89.3 /100 | #132 | Excellent 11.4% |
| Arabs | 89.1 /100 | #133 | Excellent 11.4% |
| Immigrants | Guyana | 88.3 /100 | #134 | Excellent 11.4% |
| Ugandans | 87.9 /100 | #135 | Excellent 11.4% |
| Immigrants | St. Vincent and the Grenadines | 87.8 /100 | #136 | Excellent 11.4% |