Palestinian vs Scandinavian Disability
COMPARE
Palestinian
Scandinavian
Disability
Disability Comparison
Palestinians
Scandinavians
11.1%
DISABILITY
98.9/ 100
METRIC RATING
87th/ 347
METRIC RANK
12.4%
DISABILITY
0.4/ 100
METRIC RATING
261st/ 347
METRIC RANK
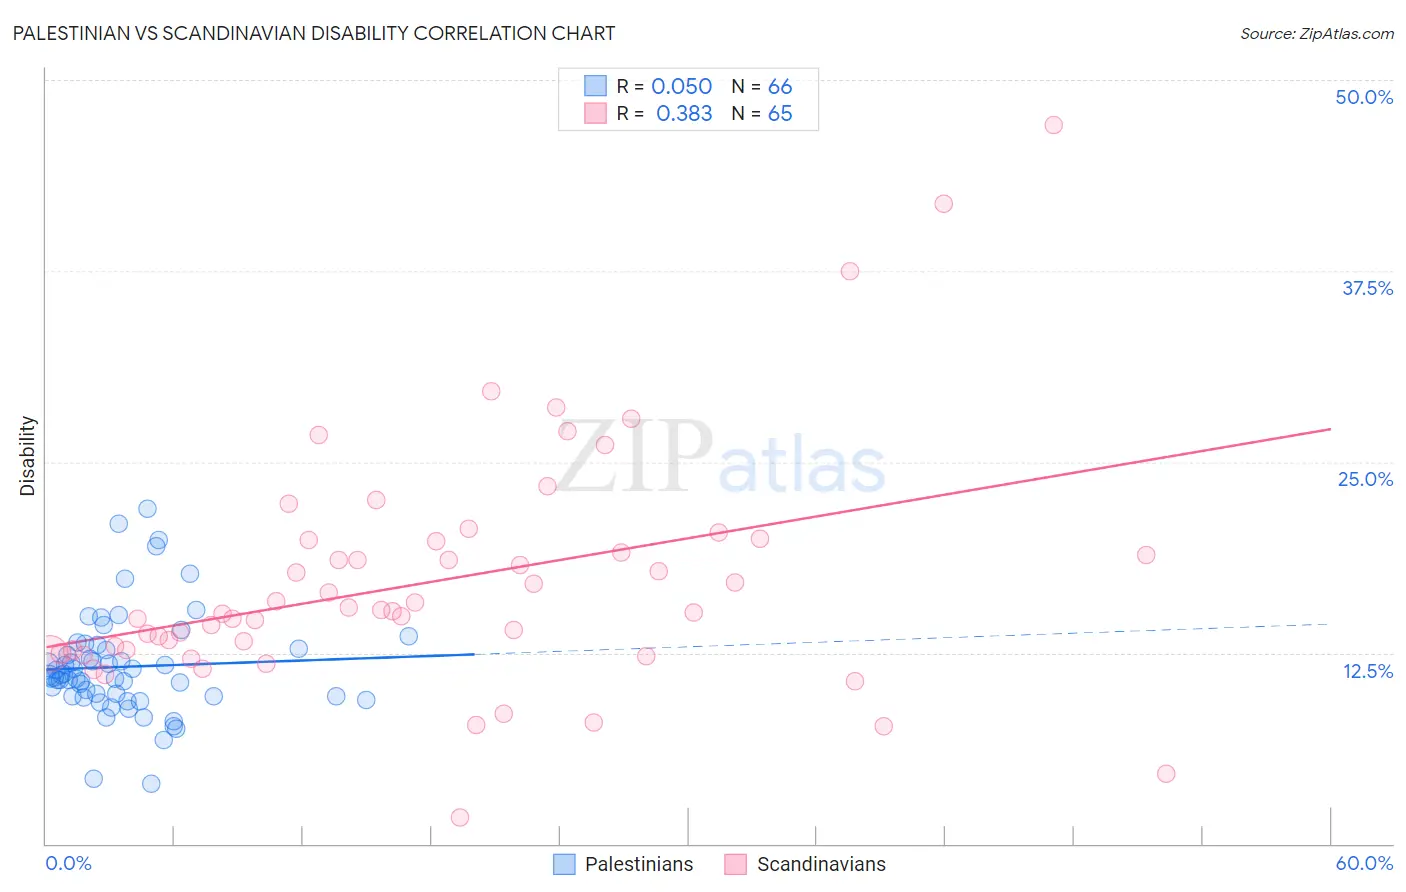
Palestinian vs Scandinavian Disability Correlation Chart
The statistical analysis conducted on geographies consisting of 216,463,663 people shows no correlation between the proportion of Palestinians and percentage of population with a disability in the United States with a correlation coefficient (R) of 0.050 and weighted average of 11.1%. Similarly, the statistical analysis conducted on geographies consisting of 472,547,672 people shows a mild positive correlation between the proportion of Scandinavians and percentage of population with a disability in the United States with a correlation coefficient (R) of 0.383 and weighted average of 12.4%, a difference of 11.6%.
Disability Correlation Summary
| Measurement | Palestinian | Scandinavian |
| Minimum | 4.0% | 1.7% |
| Maximum | 21.9% | 47.1% |
| Range | 18.0% | 45.4% |
| Mean | 11.6% | 17.2% |
| Median | 11.0% | 15.2% |
| Interquartile 25% (IQ1) | 9.7% | 12.6% |
| Interquartile 75% (IQ3) | 12.7% | 19.9% |
| Interquartile Range (IQR) | 3.1% | 7.3% |
| Standard Deviation (Sample) | 3.4% | 7.9% |
| Standard Deviation (Population) | 3.4% | 7.8% |
Similar Demographics by Disability
Demographics Similar to Palestinians by Disability
In terms of disability, the demographic groups most similar to Palestinians are Immigrants from Belarus (11.1%, a difference of 0.040%), Immigrants from Russia (11.1%, a difference of 0.040%), Immigrants from Sierra Leone (11.1%, a difference of 0.19%), Immigrants from Switzerland (11.1%, a difference of 0.20%), and Chilean (11.1%, a difference of 0.23%).
| Demographics | Rating | Rank | Disability |
| Immigrants | Ireland | 99.3 /100 | #80 | Exceptional 11.1% |
| Immigrants | Poland | 99.1 /100 | #81 | Exceptional 11.1% |
| Chileans | 99.1 /100 | #82 | Exceptional 11.1% |
| Immigrants | Switzerland | 99.0 /100 | #83 | Exceptional 11.1% |
| Immigrants | Sierra Leone | 99.0 /100 | #84 | Exceptional 11.1% |
| Immigrants | Belarus | 98.9 /100 | #85 | Exceptional 11.1% |
| Immigrants | Russia | 98.9 /100 | #86 | Exceptional 11.1% |
| Palestinians | 98.9 /100 | #87 | Exceptional 11.1% |
| Immigrants | Romania | 98.5 /100 | #88 | Exceptional 11.2% |
| Immigrants | South Africa | 98.2 /100 | #89 | Exceptional 11.2% |
| Immigrants | Brazil | 98.1 /100 | #90 | Exceptional 11.2% |
| Immigrants | Western Asia | 98.1 /100 | #91 | Exceptional 11.2% |
| Ecuadorians | 98.0 /100 | #92 | Exceptional 11.2% |
| Immigrants | Ecuador | 98.0 /100 | #93 | Exceptional 11.2% |
| Immigrants | Morocco | 97.8 /100 | #94 | Exceptional 11.2% |
Demographics Similar to Scandinavians by Disability
In terms of disability, the demographic groups most similar to Scandinavians are Immigrants from Liberia (12.4%, a difference of 0.070%), Canadian (12.4%, a difference of 0.10%), Slavic (12.4%, a difference of 0.16%), Native Hawaiian (12.5%, a difference of 0.27%), and Immigrants from Laos (12.4%, a difference of 0.30%).
| Demographics | Rating | Rank | Disability |
| German Russians | 0.8 /100 | #254 | Tragic 12.3% |
| Slovenes | 0.6 /100 | #255 | Tragic 12.4% |
| Immigrants | Dominica | 0.6 /100 | #256 | Tragic 12.4% |
| Immigrants | Laos | 0.5 /100 | #257 | Tragic 12.4% |
| Slavs | 0.5 /100 | #258 | Tragic 12.4% |
| Canadians | 0.4 /100 | #259 | Tragic 12.4% |
| Immigrants | Liberia | 0.4 /100 | #260 | Tragic 12.4% |
| Scandinavians | 0.4 /100 | #261 | Tragic 12.4% |
| Native Hawaiians | 0.3 /100 | #262 | Tragic 12.5% |
| Hawaiians | 0.2 /100 | #263 | Tragic 12.5% |
| Immigrants | Germany | 0.2 /100 | #264 | Tragic 12.5% |
| U.S. Virgin Islanders | 0.2 /100 | #265 | Tragic 12.5% |
| Czechoslovakians | 0.2 /100 | #266 | Tragic 12.5% |
| Spaniards | 0.2 /100 | #267 | Tragic 12.5% |
| Bangladeshis | 0.1 /100 | #268 | Tragic 12.6% |