Palestinian vs Moroccan Disability
COMPARE
Palestinian
Moroccan
Disability
Disability Comparison
Palestinians
Moroccans
11.1%
DISABILITY
98.9/ 100
METRIC RATING
87th/ 347
METRIC RANK
11.5%
DISABILITY
83.3/ 100
METRIC RATING
143rd/ 347
METRIC RANK
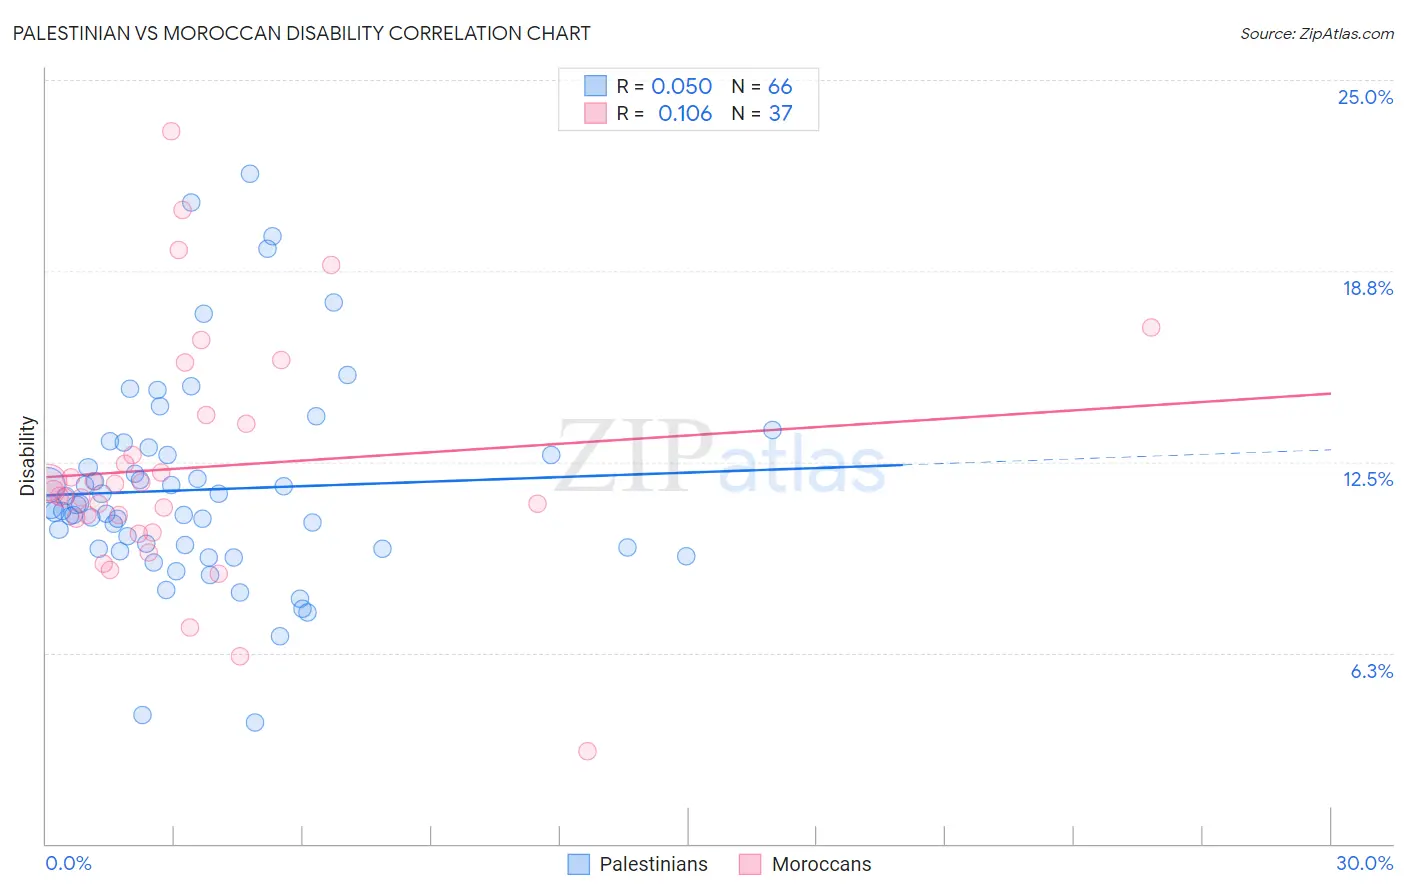
Palestinian vs Moroccan Disability Correlation Chart
The statistical analysis conducted on geographies consisting of 216,463,663 people shows no correlation between the proportion of Palestinians and percentage of population with a disability in the United States with a correlation coefficient (R) of 0.050 and weighted average of 11.1%. Similarly, the statistical analysis conducted on geographies consisting of 201,799,768 people shows a poor positive correlation between the proportion of Moroccans and percentage of population with a disability in the United States with a correlation coefficient (R) of 0.106 and weighted average of 11.5%, a difference of 3.3%.
Disability Correlation Summary
| Measurement | Palestinian | Moroccan |
| Minimum | 4.0% | 3.0% |
| Maximum | 21.9% | 23.3% |
| Range | 18.0% | 20.3% |
| Mean | 11.6% | 12.3% |
| Median | 11.0% | 11.5% |
| Interquartile 25% (IQ1) | 9.7% | 10.4% |
| Interquartile 75% (IQ3) | 12.7% | 13.9% |
| Interquartile Range (IQR) | 3.1% | 3.5% |
| Standard Deviation (Sample) | 3.4% | 4.0% |
| Standard Deviation (Population) | 3.4% | 3.9% |
Similar Demographics by Disability
Demographics Similar to Palestinians by Disability
In terms of disability, the demographic groups most similar to Palestinians are Immigrants from Belarus (11.1%, a difference of 0.040%), Immigrants from Russia (11.1%, a difference of 0.040%), Immigrants from Sierra Leone (11.1%, a difference of 0.19%), Immigrants from Switzerland (11.1%, a difference of 0.20%), and Chilean (11.1%, a difference of 0.23%).
| Demographics | Rating | Rank | Disability |
| Immigrants | Ireland | 99.3 /100 | #80 | Exceptional 11.1% |
| Immigrants | Poland | 99.1 /100 | #81 | Exceptional 11.1% |
| Chileans | 99.1 /100 | #82 | Exceptional 11.1% |
| Immigrants | Switzerland | 99.0 /100 | #83 | Exceptional 11.1% |
| Immigrants | Sierra Leone | 99.0 /100 | #84 | Exceptional 11.1% |
| Immigrants | Belarus | 98.9 /100 | #85 | Exceptional 11.1% |
| Immigrants | Russia | 98.9 /100 | #86 | Exceptional 11.1% |
| Palestinians | 98.9 /100 | #87 | Exceptional 11.1% |
| Immigrants | Romania | 98.5 /100 | #88 | Exceptional 11.2% |
| Immigrants | South Africa | 98.2 /100 | #89 | Exceptional 11.2% |
| Immigrants | Brazil | 98.1 /100 | #90 | Exceptional 11.2% |
| Immigrants | Western Asia | 98.1 /100 | #91 | Exceptional 11.2% |
| Ecuadorians | 98.0 /100 | #92 | Exceptional 11.2% |
| Immigrants | Ecuador | 98.0 /100 | #93 | Exceptional 11.2% |
| Immigrants | Morocco | 97.8 /100 | #94 | Exceptional 11.2% |
Demographics Similar to Moroccans by Disability
In terms of disability, the demographic groups most similar to Moroccans are Australian (11.5%, a difference of 0.070%), Nigerian (11.5%, a difference of 0.15%), Immigrants from Sudan (11.5%, a difference of 0.17%), Immigrants from Grenada (11.5%, a difference of 0.25%), and Russian (11.5%, a difference of 0.31%).
| Demographics | Rating | Rank | Disability |
| Immigrants | St. Vincent and the Grenadines | 87.8 /100 | #136 | Excellent 11.4% |
| Kenyans | 87.1 /100 | #137 | Excellent 11.5% |
| New Zealanders | 87.0 /100 | #138 | Excellent 11.5% |
| Ghanaians | 87.0 /100 | #139 | Excellent 11.5% |
| Russians | 86.8 /100 | #140 | Excellent 11.5% |
| Immigrants | Grenada | 86.1 /100 | #141 | Excellent 11.5% |
| Immigrants | Sudan | 85.3 /100 | #142 | Excellent 11.5% |
| Moroccans | 83.3 /100 | #143 | Excellent 11.5% |
| Australians | 82.5 /100 | #144 | Excellent 11.5% |
| Nigerians | 81.3 /100 | #145 | Excellent 11.5% |
| Immigrants | Hungary | 79.0 /100 | #146 | Good 11.5% |
| Immigrants | Ukraine | 77.6 /100 | #147 | Good 11.5% |
| Sudanese | 77.1 /100 | #148 | Good 11.5% |
| Immigrants | Norway | 73.2 /100 | #149 | Good 11.6% |
| Romanians | 72.7 /100 | #150 | Good 11.6% |