Ukrainian vs Macedonian Disability
COMPARE
Ukrainian
Macedonian
Disability
Disability Comparison
Ukrainians
Macedonians
11.9%
DISABILITY
14.7/ 100
METRIC RATING
198th/ 347
METRIC RANK
11.4%
DISABILITY
90.3/ 100
METRIC RATING
129th/ 347
METRIC RANK
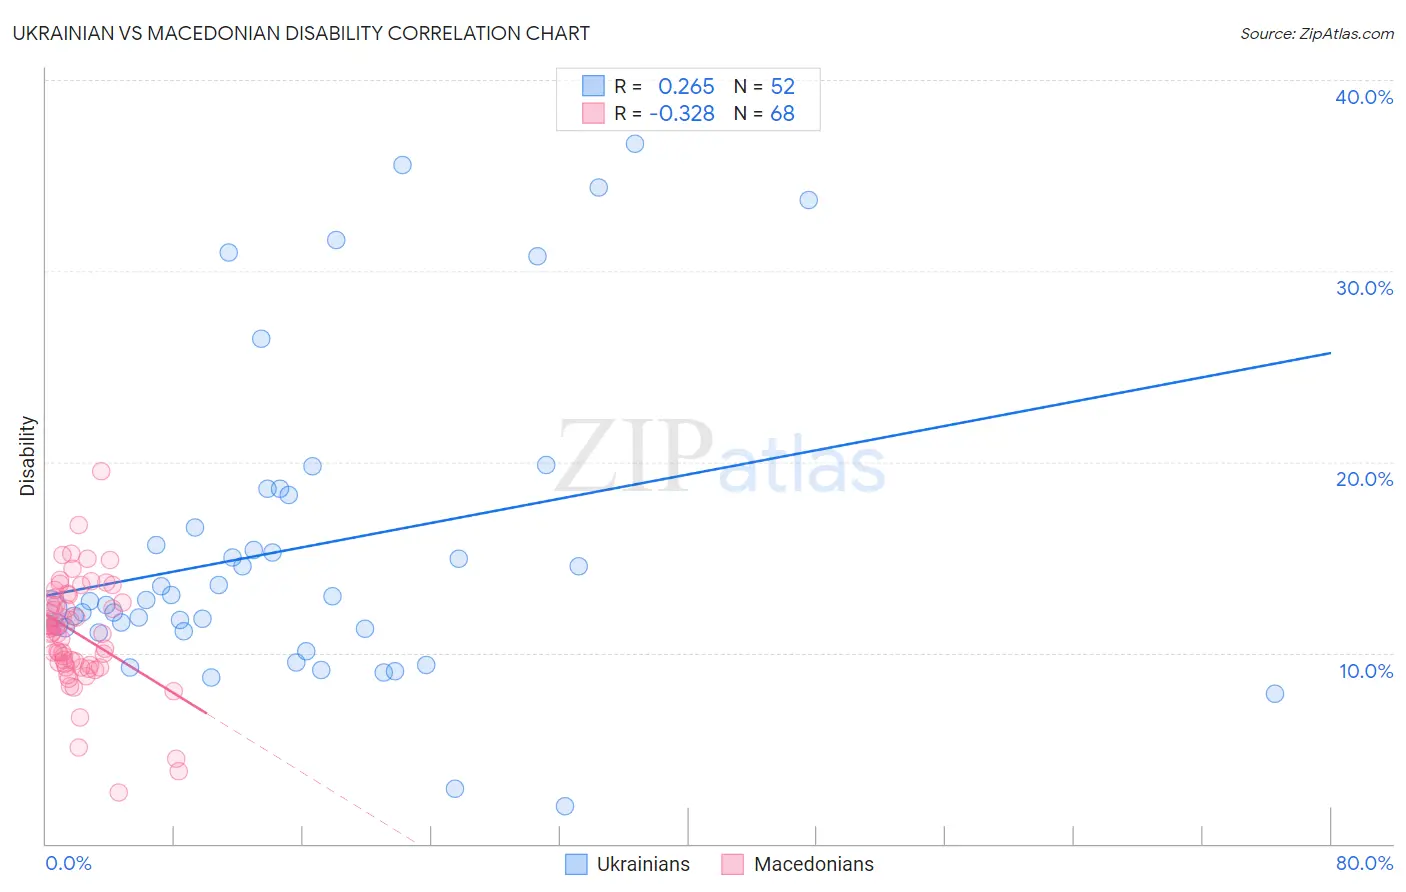
Ukrainian vs Macedonian Disability Correlation Chart
The statistical analysis conducted on geographies consisting of 448,640,628 people shows a weak positive correlation between the proportion of Ukrainians and percentage of population with a disability in the United States with a correlation coefficient (R) of 0.265 and weighted average of 11.9%. Similarly, the statistical analysis conducted on geographies consisting of 132,658,992 people shows a mild negative correlation between the proportion of Macedonians and percentage of population with a disability in the United States with a correlation coefficient (R) of -0.328 and weighted average of 11.4%, a difference of 4.5%.
Disability Correlation Summary
| Measurement | Ukrainian | Macedonian |
| Minimum | 1.9% | 2.7% |
| Maximum | 36.7% | 19.5% |
| Range | 34.7% | 16.8% |
| Mean | 15.5% | 11.0% |
| Median | 12.7% | 11.2% |
| Interquartile 25% (IQ1) | 11.2% | 9.4% |
| Interquartile 75% (IQ3) | 17.4% | 12.8% |
| Interquartile Range (IQR) | 6.2% | 3.4% |
| Standard Deviation (Sample) | 8.2% | 2.9% |
| Standard Deviation (Population) | 8.1% | 2.9% |
Similar Demographics by Disability
Demographics Similar to Ukrainians by Disability
In terms of disability, the demographic groups most similar to Ukrainians are Immigrants from Panama (11.9%, a difference of 0.010%), Immigrants from Belize (11.9%, a difference of 0.050%), Serbian (11.9%, a difference of 0.060%), Barbadian (11.9%, a difference of 0.10%), and Belizean (11.9%, a difference of 0.17%).
| Demographics | Rating | Rank | Disability |
| Ute | 19.5 /100 | #191 | Poor 11.9% |
| Lithuanians | 18.8 /100 | #192 | Poor 11.9% |
| Immigrants | Bosnia and Herzegovina | 18.0 /100 | #193 | Poor 11.9% |
| Somalis | 17.3 /100 | #194 | Poor 11.9% |
| Barbadians | 15.8 /100 | #195 | Poor 11.9% |
| Serbians | 15.4 /100 | #196 | Poor 11.9% |
| Immigrants | Belize | 15.2 /100 | #197 | Poor 11.9% |
| Ukrainians | 14.7 /100 | #198 | Poor 11.9% |
| Immigrants | Panama | 14.6 /100 | #199 | Poor 11.9% |
| Belizeans | 12.8 /100 | #200 | Poor 11.9% |
| Assyrians/Chaldeans/Syriacs | 12.6 /100 | #201 | Poor 11.9% |
| Immigrants | England | 12.0 /100 | #202 | Poor 12.0% |
| British West Indians | 11.5 /100 | #203 | Poor 12.0% |
| Mexican American Indians | 11.4 /100 | #204 | Poor 12.0% |
| Immigrants | Western Europe | 10.1 /100 | #205 | Poor 12.0% |
Demographics Similar to Macedonians by Disability
In terms of disability, the demographic groups most similar to Macedonians are Immigrants from Europe (11.4%, a difference of 0.010%), Immigrants from Italy (11.4%, a difference of 0.020%), Latvian (11.4%, a difference of 0.060%), Immigrants from Croatia (11.4%, a difference of 0.060%), and Immigrants from Latvia (11.4%, a difference of 0.080%).
| Demographics | Rating | Rank | Disability |
| Brazilians | 93.3 /100 | #122 | Exceptional 11.4% |
| South Africans | 92.3 /100 | #123 | Exceptional 11.4% |
| South American Indians | 92.2 /100 | #124 | Exceptional 11.4% |
| Costa Ricans | 91.9 /100 | #125 | Exceptional 11.4% |
| Immigrants | Latvia | 90.9 /100 | #126 | Exceptional 11.4% |
| Immigrants | Italy | 90.4 /100 | #127 | Exceptional 11.4% |
| Immigrants | Europe | 90.4 /100 | #128 | Exceptional 11.4% |
| Macedonians | 90.3 /100 | #129 | Exceptional 11.4% |
| Latvians | 89.8 /100 | #130 | Excellent 11.4% |
| Immigrants | Croatia | 89.8 /100 | #131 | Excellent 11.4% |
| Immigrants | Africa | 89.3 /100 | #132 | Excellent 11.4% |
| Arabs | 89.1 /100 | #133 | Excellent 11.4% |
| Immigrants | Guyana | 88.3 /100 | #134 | Excellent 11.4% |
| Ugandans | 87.9 /100 | #135 | Excellent 11.4% |
| Immigrants | St. Vincent and the Grenadines | 87.8 /100 | #136 | Excellent 11.4% |