Palestinian vs Macedonian Vision Disability
COMPARE
Palestinian
Macedonian
Vision Disability
Vision Disability Comparison
Palestinians
Macedonians
2.0%
VISION DISABILITY
98.3/ 100
METRIC RATING
74th/ 347
METRIC RANK
2.0%
VISION DISABILITY
99.3/ 100
METRIC RATING
54th/ 347
METRIC RANK
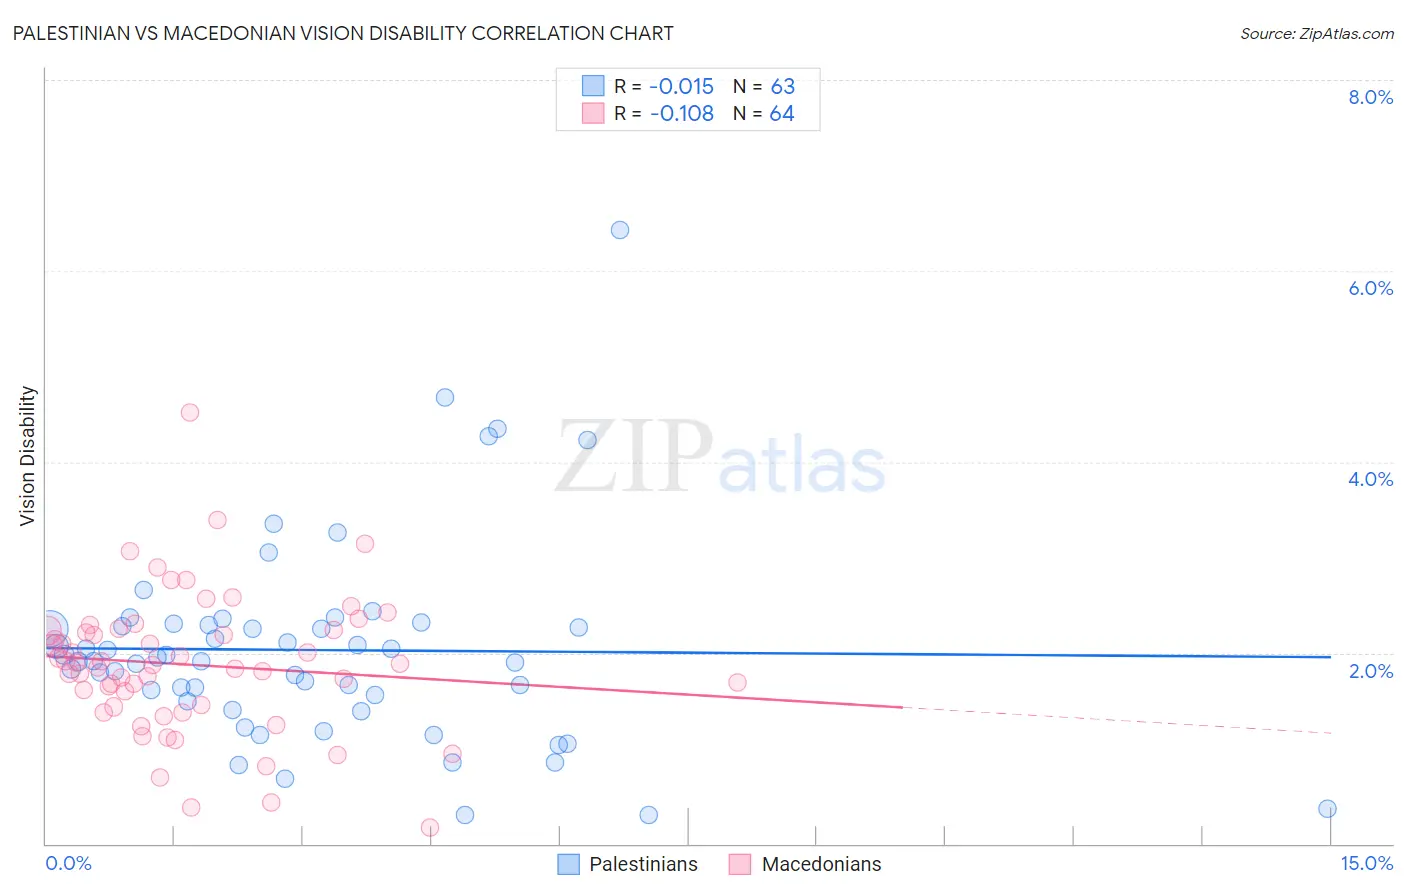
Palestinian vs Macedonian Vision Disability Correlation Chart
The statistical analysis conducted on geographies consisting of 216,427,848 people shows no correlation between the proportion of Palestinians and percentage of population with vision disability in the United States with a correlation coefficient (R) of -0.015 and weighted average of 2.0%. Similarly, the statistical analysis conducted on geographies consisting of 132,627,302 people shows a poor negative correlation between the proportion of Macedonians and percentage of population with vision disability in the United States with a correlation coefficient (R) of -0.108 and weighted average of 2.0%, a difference of 1.6%.
Vision Disability Correlation Summary
| Measurement | Palestinian | Macedonian |
| Minimum | 0.30% | 0.17% |
| Maximum | 6.4% | 4.5% |
| Range | 6.1% | 4.4% |
| Mean | 2.0% | 1.9% |
| Median | 1.9% | 1.9% |
| Interquartile 25% (IQ1) | 1.5% | 1.4% |
| Interquartile 75% (IQ3) | 2.3% | 2.2% |
| Interquartile Range (IQR) | 0.81% | 0.79% |
| Standard Deviation (Sample) | 1.1% | 0.73% |
| Standard Deviation (Population) | 1.1% | 0.73% |
Demographics Similar to Palestinians and Macedonians by Vision Disability
In terms of vision disability, the demographic groups most similar to Palestinians are Immigrants from Eritrea (2.0%, a difference of 0.050%), Immigrants from France (2.0%, a difference of 0.25%), Immigrants from Northern Europe (2.0%, a difference of 0.30%), Immigrants from Kazakhstan (2.0%, a difference of 0.31%), and Russian (2.0%, a difference of 0.33%). Similarly, the demographic groups most similar to Macedonians are Laotian (2.0%, a difference of 0.060%), Jordanian (2.0%, a difference of 0.22%), Somali (2.0%, a difference of 0.24%), Immigrants from Saudi Arabia (2.0%, a difference of 0.31%), and Argentinean (2.0%, a difference of 0.46%).
| Demographics | Rating | Rank | Vision Disability |
| Macedonians | 99.3 /100 | #54 | Exceptional 2.0% |
| Laotians | 99.3 /100 | #55 | Exceptional 2.0% |
| Jordanians | 99.2 /100 | #56 | Exceptional 2.0% |
| Somalis | 99.2 /100 | #57 | Exceptional 2.0% |
| Immigrants | Saudi Arabia | 99.2 /100 | #58 | Exceptional 2.0% |
| Argentineans | 99.1 /100 | #59 | Exceptional 2.0% |
| Immigrants | Romania | 99.1 /100 | #60 | Exceptional 2.0% |
| Immigrants | Belgium | 99.1 /100 | #61 | Exceptional 2.0% |
| Immigrants | Russia | 99.1 /100 | #62 | Exceptional 2.0% |
| Armenians | 99.0 /100 | #63 | Exceptional 2.0% |
| Immigrants | Greece | 99.0 /100 | #64 | Exceptional 2.0% |
| Maltese | 98.9 /100 | #65 | Exceptional 2.0% |
| Immigrants | Argentina | 98.9 /100 | #66 | Exceptional 2.0% |
| Immigrants | Northern Africa | 98.8 /100 | #67 | Exceptional 2.0% |
| Immigrants | Czechoslovakia | 98.7 /100 | #68 | Exceptional 2.0% |
| Russians | 98.6 /100 | #69 | Exceptional 2.0% |
| Immigrants | Kazakhstan | 98.6 /100 | #70 | Exceptional 2.0% |
| Immigrants | Northern Europe | 98.6 /100 | #71 | Exceptional 2.0% |
| Immigrants | France | 98.5 /100 | #72 | Exceptional 2.0% |
| Immigrants | Eritrea | 98.4 /100 | #73 | Exceptional 2.0% |
| Palestinians | 98.3 /100 | #74 | Exceptional 2.0% |