Aleut vs Macedonian Disability
COMPARE
Aleut
Macedonian
Disability
Disability Comparison
Aleuts
Macedonians
13.1%
DISABILITY
0.0/ 100
METRIC RATING
292nd/ 347
METRIC RANK
11.4%
DISABILITY
90.3/ 100
METRIC RATING
129th/ 347
METRIC RANK
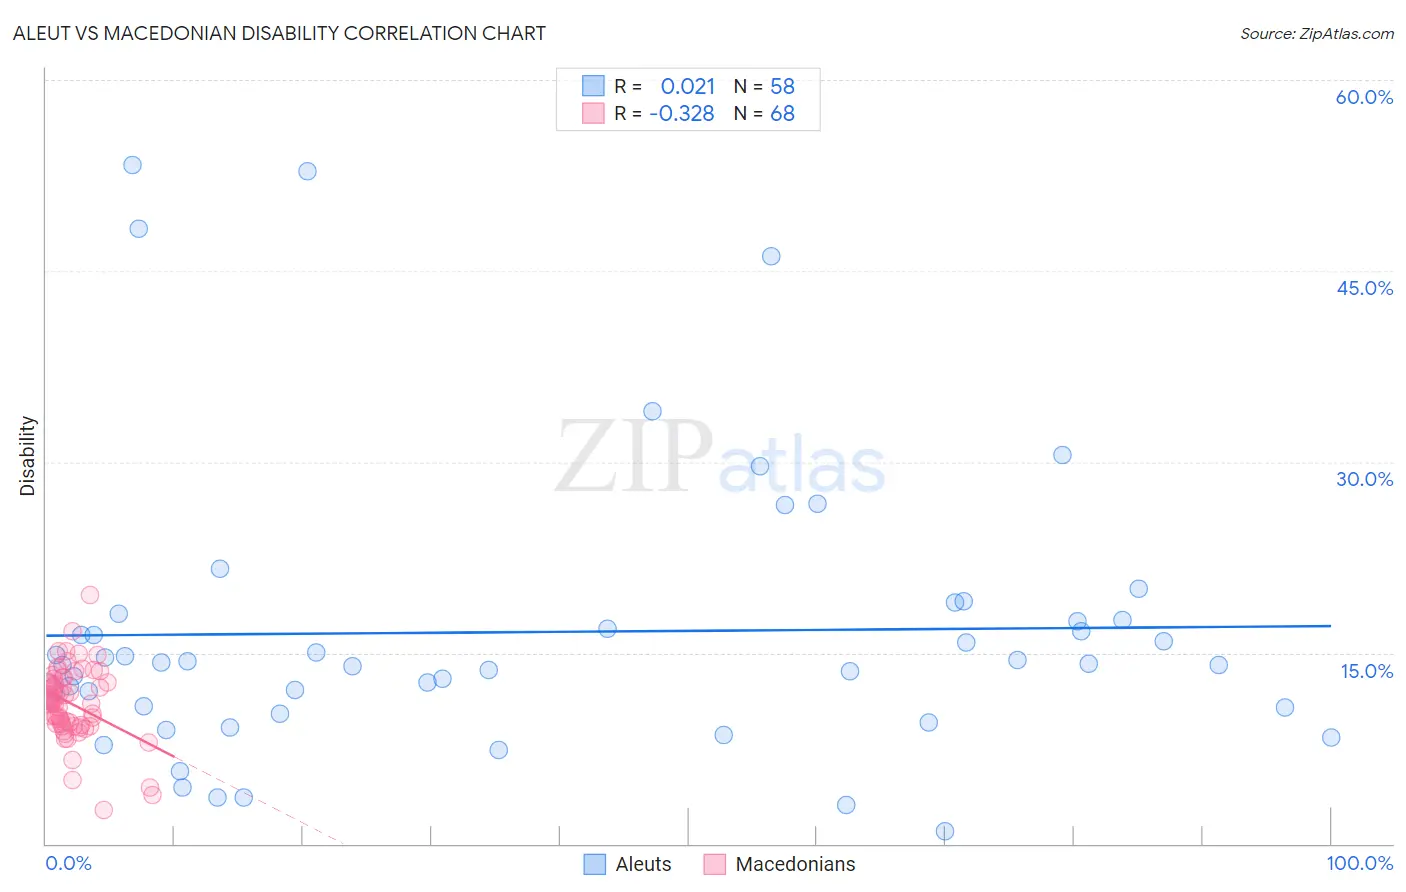
Aleut vs Macedonian Disability Correlation Chart
The statistical analysis conducted on geographies consisting of 61,782,940 people shows no correlation between the proportion of Aleuts and percentage of population with a disability in the United States with a correlation coefficient (R) of 0.021 and weighted average of 13.1%. Similarly, the statistical analysis conducted on geographies consisting of 132,658,992 people shows a mild negative correlation between the proportion of Macedonians and percentage of population with a disability in the United States with a correlation coefficient (R) of -0.328 and weighted average of 11.4%, a difference of 14.8%.
Disability Correlation Summary
| Measurement | Aleut | Macedonian |
| Minimum | 0.97% | 2.7% |
| Maximum | 53.3% | 19.5% |
| Range | 52.4% | 16.8% |
| Mean | 16.6% | 11.0% |
| Median | 14.2% | 11.2% |
| Interquartile 25% (IQ1) | 10.7% | 9.4% |
| Interquartile 75% (IQ3) | 17.6% | 12.8% |
| Interquartile Range (IQR) | 6.9% | 3.4% |
| Standard Deviation (Sample) | 11.3% | 2.9% |
| Standard Deviation (Population) | 11.2% | 2.9% |
Similar Demographics by Disability
Demographics Similar to Aleuts by Disability
In terms of disability, the demographic groups most similar to Aleuts are Marshallese (13.1%, a difference of 0.0%), Celtic (13.1%, a difference of 0.30%), Yaqui (13.1%, a difference of 0.36%), Nonimmigrants (13.2%, a difference of 0.42%), and Central American Indian (13.2%, a difference of 0.46%).
| Demographics | Rating | Rank | Disability |
| Crow | 0.0 /100 | #285 | Tragic 12.9% |
| English | 0.0 /100 | #286 | Tragic 13.0% |
| Africans | 0.0 /100 | #287 | Tragic 13.0% |
| Whites/Caucasians | 0.0 /100 | #288 | Tragic 13.0% |
| Slovaks | 0.0 /100 | #289 | Tragic 13.0% |
| Cheyenne | 0.0 /100 | #290 | Tragic 13.0% |
| Yaqui | 0.0 /100 | #291 | Tragic 13.1% |
| Aleuts | 0.0 /100 | #292 | Tragic 13.1% |
| Marshallese | 0.0 /100 | #293 | Tragic 13.1% |
| Celtics | 0.0 /100 | #294 | Tragic 13.1% |
| Immigrants | Nonimmigrants | 0.0 /100 | #295 | Tragic 13.2% |
| Central American Indians | 0.0 /100 | #296 | Tragic 13.2% |
| Hopi | 0.0 /100 | #297 | Tragic 13.2% |
| Alaska Natives | 0.0 /100 | #298 | Tragic 13.2% |
| French | 0.0 /100 | #299 | Tragic 13.2% |
Demographics Similar to Macedonians by Disability
In terms of disability, the demographic groups most similar to Macedonians are Immigrants from Europe (11.4%, a difference of 0.010%), Immigrants from Italy (11.4%, a difference of 0.020%), Latvian (11.4%, a difference of 0.060%), Immigrants from Croatia (11.4%, a difference of 0.060%), and Immigrants from Latvia (11.4%, a difference of 0.080%).
| Demographics | Rating | Rank | Disability |
| Brazilians | 93.3 /100 | #122 | Exceptional 11.4% |
| South Africans | 92.3 /100 | #123 | Exceptional 11.4% |
| South American Indians | 92.2 /100 | #124 | Exceptional 11.4% |
| Costa Ricans | 91.9 /100 | #125 | Exceptional 11.4% |
| Immigrants | Latvia | 90.9 /100 | #126 | Exceptional 11.4% |
| Immigrants | Italy | 90.4 /100 | #127 | Exceptional 11.4% |
| Immigrants | Europe | 90.4 /100 | #128 | Exceptional 11.4% |
| Macedonians | 90.3 /100 | #129 | Exceptional 11.4% |
| Latvians | 89.8 /100 | #130 | Excellent 11.4% |
| Immigrants | Croatia | 89.8 /100 | #131 | Excellent 11.4% |
| Immigrants | Africa | 89.3 /100 | #132 | Excellent 11.4% |
| Arabs | 89.1 /100 | #133 | Excellent 11.4% |
| Immigrants | Guyana | 88.3 /100 | #134 | Excellent 11.4% |
| Ugandans | 87.9 /100 | #135 | Excellent 11.4% |
| Immigrants | St. Vincent and the Grenadines | 87.8 /100 | #136 | Excellent 11.4% |