Peruvian vs Macedonian Disability
COMPARE
Peruvian
Macedonian
Disability
Disability Comparison
Peruvians
Macedonians
10.9%
DISABILITY
99.8/ 100
METRIC RATING
51st/ 347
METRIC RANK
11.4%
DISABILITY
90.3/ 100
METRIC RATING
129th/ 347
METRIC RANK
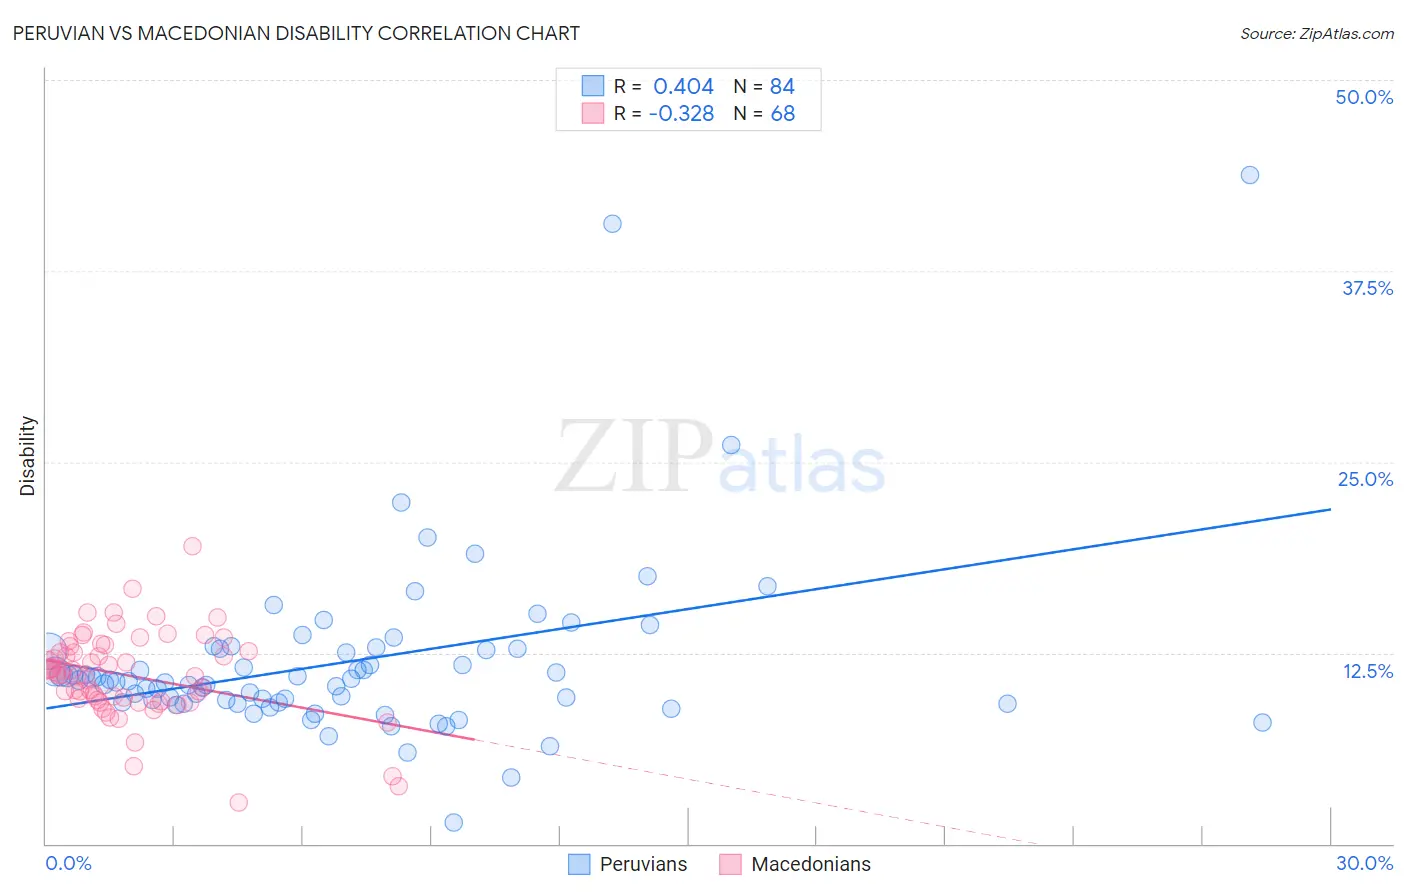
Peruvian vs Macedonian Disability Correlation Chart
The statistical analysis conducted on geographies consisting of 363,197,931 people shows a moderate positive correlation between the proportion of Peruvians and percentage of population with a disability in the United States with a correlation coefficient (R) of 0.404 and weighted average of 10.9%. Similarly, the statistical analysis conducted on geographies consisting of 132,658,992 people shows a mild negative correlation between the proportion of Macedonians and percentage of population with a disability in the United States with a correlation coefficient (R) of -0.328 and weighted average of 11.4%, a difference of 5.1%.
Disability Correlation Summary
| Measurement | Peruvian | Macedonian |
| Minimum | 1.4% | 2.7% |
| Maximum | 43.8% | 19.5% |
| Range | 42.4% | 16.8% |
| Mean | 11.9% | 11.0% |
| Median | 10.7% | 11.2% |
| Interquartile 25% (IQ1) | 9.2% | 9.4% |
| Interquartile 75% (IQ3) | 12.7% | 12.8% |
| Interquartile Range (IQR) | 3.5% | 3.4% |
| Standard Deviation (Sample) | 6.0% | 2.9% |
| Standard Deviation (Population) | 5.9% | 2.9% |
Similar Demographics by Disability
Demographics Similar to Peruvians by Disability
In terms of disability, the demographic groups most similar to Peruvians are Vietnamese (10.9%, a difference of 0.010%), Immigrants from Saudi Arabia (10.9%, a difference of 0.010%), South American (10.9%, a difference of 0.060%), Soviet Union (10.9%, a difference of 0.070%), and Immigrants from Spain (10.9%, a difference of 0.080%).
| Demographics | Rating | Rank | Disability |
| Immigrants | Japan | 99.9 /100 | #44 | Exceptional 10.8% |
| Immigrants | Peru | 99.9 /100 | #45 | Exceptional 10.8% |
| Tongans | 99.9 /100 | #46 | Exceptional 10.8% |
| Taiwanese | 99.9 /100 | #47 | Exceptional 10.8% |
| Soviet Union | 99.9 /100 | #48 | Exceptional 10.9% |
| Vietnamese | 99.9 /100 | #49 | Exceptional 10.9% |
| Immigrants | Saudi Arabia | 99.9 /100 | #50 | Exceptional 10.9% |
| Peruvians | 99.8 /100 | #51 | Exceptional 10.9% |
| South Americans | 99.8 /100 | #52 | Exceptional 10.9% |
| Immigrants | Spain | 99.8 /100 | #53 | Exceptional 10.9% |
| Jordanians | 99.8 /100 | #54 | Exceptional 10.9% |
| Immigrants | El Salvador | 99.8 /100 | #55 | Exceptional 10.9% |
| Immigrants | Lithuania | 99.8 /100 | #56 | Exceptional 10.9% |
| Salvadorans | 99.8 /100 | #57 | Exceptional 10.9% |
| Immigrants | South America | 99.8 /100 | #58 | Exceptional 10.9% |
Demographics Similar to Macedonians by Disability
In terms of disability, the demographic groups most similar to Macedonians are Immigrants from Europe (11.4%, a difference of 0.010%), Immigrants from Italy (11.4%, a difference of 0.020%), Latvian (11.4%, a difference of 0.060%), Immigrants from Croatia (11.4%, a difference of 0.060%), and Immigrants from Latvia (11.4%, a difference of 0.080%).
| Demographics | Rating | Rank | Disability |
| Brazilians | 93.3 /100 | #122 | Exceptional 11.4% |
| South Africans | 92.3 /100 | #123 | Exceptional 11.4% |
| South American Indians | 92.2 /100 | #124 | Exceptional 11.4% |
| Costa Ricans | 91.9 /100 | #125 | Exceptional 11.4% |
| Immigrants | Latvia | 90.9 /100 | #126 | Exceptional 11.4% |
| Immigrants | Italy | 90.4 /100 | #127 | Exceptional 11.4% |
| Immigrants | Europe | 90.4 /100 | #128 | Exceptional 11.4% |
| Macedonians | 90.3 /100 | #129 | Exceptional 11.4% |
| Latvians | 89.8 /100 | #130 | Excellent 11.4% |
| Immigrants | Croatia | 89.8 /100 | #131 | Excellent 11.4% |
| Immigrants | Africa | 89.3 /100 | #132 | Excellent 11.4% |
| Arabs | 89.1 /100 | #133 | Excellent 11.4% |
| Immigrants | Guyana | 88.3 /100 | #134 | Excellent 11.4% |
| Ugandans | 87.9 /100 | #135 | Excellent 11.4% |
| Immigrants | St. Vincent and the Grenadines | 87.8 /100 | #136 | Excellent 11.4% |