Palestinian vs Immigrants from Micronesia Disability
COMPARE
Palestinian
Immigrants from Micronesia
Disability
Disability Comparison
Palestinians
Immigrants from Micronesia
11.1%
DISABILITY
98.9/ 100
METRIC RATING
87th/ 347
METRIC RANK
13.2%
DISABILITY
0.0/ 100
METRIC RATING
301st/ 347
METRIC RANK
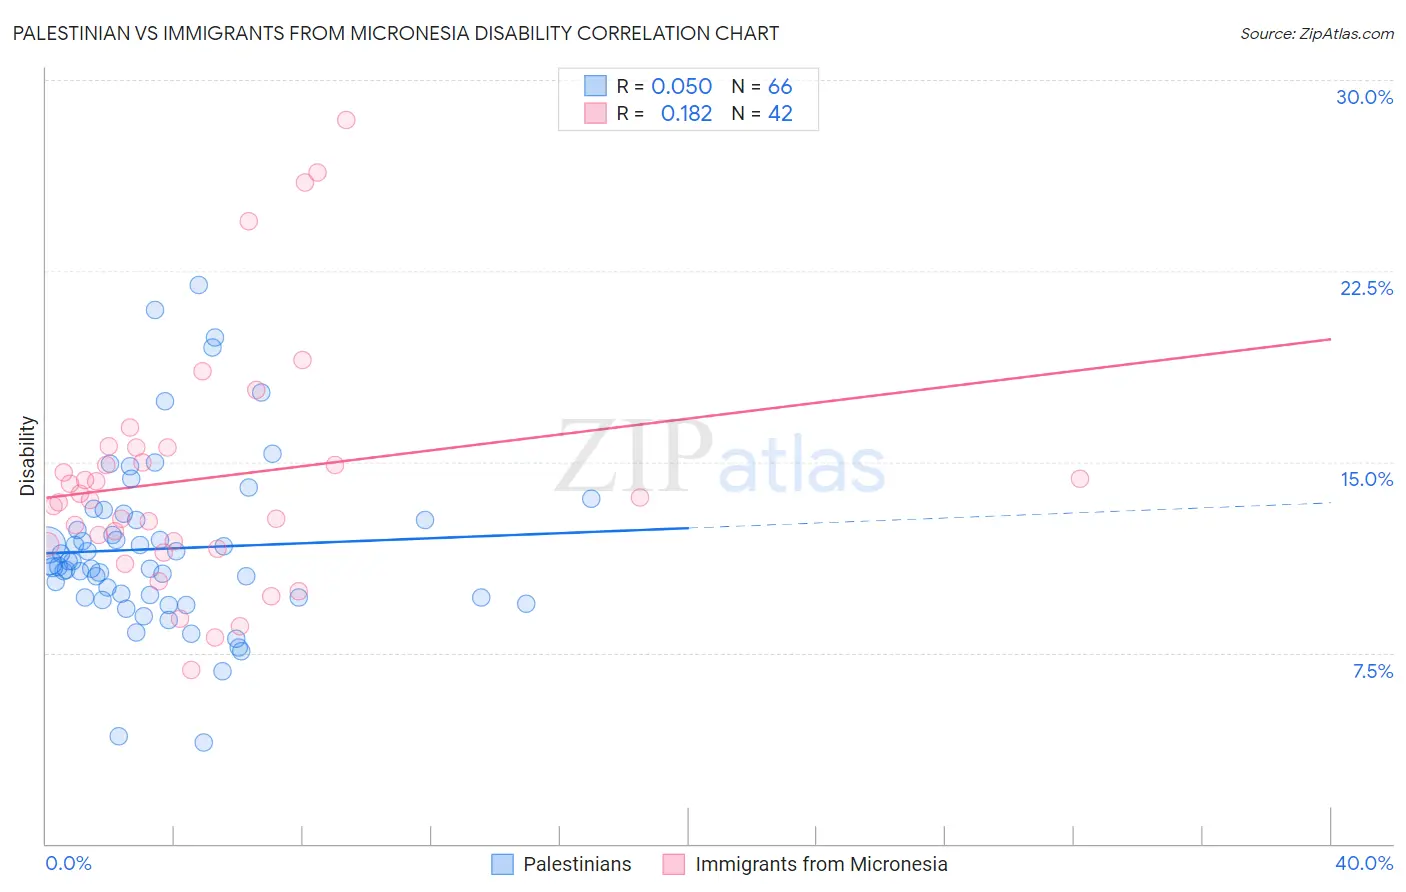
Palestinian vs Immigrants from Micronesia Disability Correlation Chart
The statistical analysis conducted on geographies consisting of 216,463,663 people shows no correlation between the proportion of Palestinians and percentage of population with a disability in the United States with a correlation coefficient (R) of 0.050 and weighted average of 11.1%. Similarly, the statistical analysis conducted on geographies consisting of 61,603,452 people shows a poor positive correlation between the proportion of Immigrants from Micronesia and percentage of population with a disability in the United States with a correlation coefficient (R) of 0.182 and weighted average of 13.2%, a difference of 18.6%.
Disability Correlation Summary
| Measurement | Palestinian | Immigrants from Micronesia |
| Minimum | 4.0% | 6.8% |
| Maximum | 21.9% | 28.4% |
| Range | 18.0% | 21.6% |
| Mean | 11.6% | 14.3% |
| Median | 11.0% | 13.6% |
| Interquartile 25% (IQ1) | 9.7% | 11.8% |
| Interquartile 75% (IQ3) | 12.7% | 15.6% |
| Interquartile Range (IQR) | 3.1% | 3.8% |
| Standard Deviation (Sample) | 3.4% | 4.7% |
| Standard Deviation (Population) | 3.4% | 4.7% |
Similar Demographics by Disability
Demographics Similar to Palestinians by Disability
In terms of disability, the demographic groups most similar to Palestinians are Immigrants from Belarus (11.1%, a difference of 0.040%), Immigrants from Russia (11.1%, a difference of 0.040%), Immigrants from Sierra Leone (11.1%, a difference of 0.19%), Immigrants from Switzerland (11.1%, a difference of 0.20%), and Chilean (11.1%, a difference of 0.23%).
| Demographics | Rating | Rank | Disability |
| Immigrants | Ireland | 99.3 /100 | #80 | Exceptional 11.1% |
| Immigrants | Poland | 99.1 /100 | #81 | Exceptional 11.1% |
| Chileans | 99.1 /100 | #82 | Exceptional 11.1% |
| Immigrants | Switzerland | 99.0 /100 | #83 | Exceptional 11.1% |
| Immigrants | Sierra Leone | 99.0 /100 | #84 | Exceptional 11.1% |
| Immigrants | Belarus | 98.9 /100 | #85 | Exceptional 11.1% |
| Immigrants | Russia | 98.9 /100 | #86 | Exceptional 11.1% |
| Palestinians | 98.9 /100 | #87 | Exceptional 11.1% |
| Immigrants | Romania | 98.5 /100 | #88 | Exceptional 11.2% |
| Immigrants | South Africa | 98.2 /100 | #89 | Exceptional 11.2% |
| Immigrants | Brazil | 98.1 /100 | #90 | Exceptional 11.2% |
| Immigrants | Western Asia | 98.1 /100 | #91 | Exceptional 11.2% |
| Ecuadorians | 98.0 /100 | #92 | Exceptional 11.2% |
| Immigrants | Ecuador | 98.0 /100 | #93 | Exceptional 11.2% |
| Immigrants | Morocco | 97.8 /100 | #94 | Exceptional 11.2% |
Demographics Similar to Immigrants from Micronesia by Disability
In terms of disability, the demographic groups most similar to Immigrants from Micronesia are Pennsylvania German (13.2%, a difference of 0.090%), French (13.2%, a difference of 0.13%), Alaska Native (13.2%, a difference of 0.15%), Hopi (13.2%, a difference of 0.16%), and Arapaho (13.2%, a difference of 0.21%).
| Demographics | Rating | Rank | Disability |
| Celtics | 0.0 /100 | #294 | Tragic 13.1% |
| Immigrants | Nonimmigrants | 0.0 /100 | #295 | Tragic 13.2% |
| Central American Indians | 0.0 /100 | #296 | Tragic 13.2% |
| Hopi | 0.0 /100 | #297 | Tragic 13.2% |
| Alaska Natives | 0.0 /100 | #298 | Tragic 13.2% |
| French | 0.0 /100 | #299 | Tragic 13.2% |
| Pennsylvania Germans | 0.0 /100 | #300 | Tragic 13.2% |
| Immigrants | Micronesia | 0.0 /100 | #301 | Tragic 13.2% |
| Arapaho | 0.0 /100 | #302 | Tragic 13.2% |
| Scotch-Irish | 0.0 /100 | #303 | Tragic 13.3% |
| Yakama | 0.0 /100 | #304 | Tragic 13.4% |
| French Canadians | 0.0 /100 | #305 | Tragic 13.4% |
| Cape Verdeans | 0.0 /100 | #306 | Tragic 13.5% |
| Shoshone | 0.0 /100 | #307 | Tragic 13.5% |
| French American Indians | 0.0 /100 | #308 | Tragic 13.5% |