Pakistani vs Immigrants from Norway Disability Age 5 to 17
COMPARE
Pakistani
Immigrants from Norway
Disability Age 5 to 17
Disability Age 5 to 17 Comparison
Pakistanis
Immigrants from Norway
5.5%
DISABILITY AGE 5 TO 17
87.3/ 100
METRIC RATING
144th/ 347
METRIC RANK
5.6%
DISABILITY AGE 5 TO 17
55.7/ 100
METRIC RATING
169th/ 347
METRIC RANK
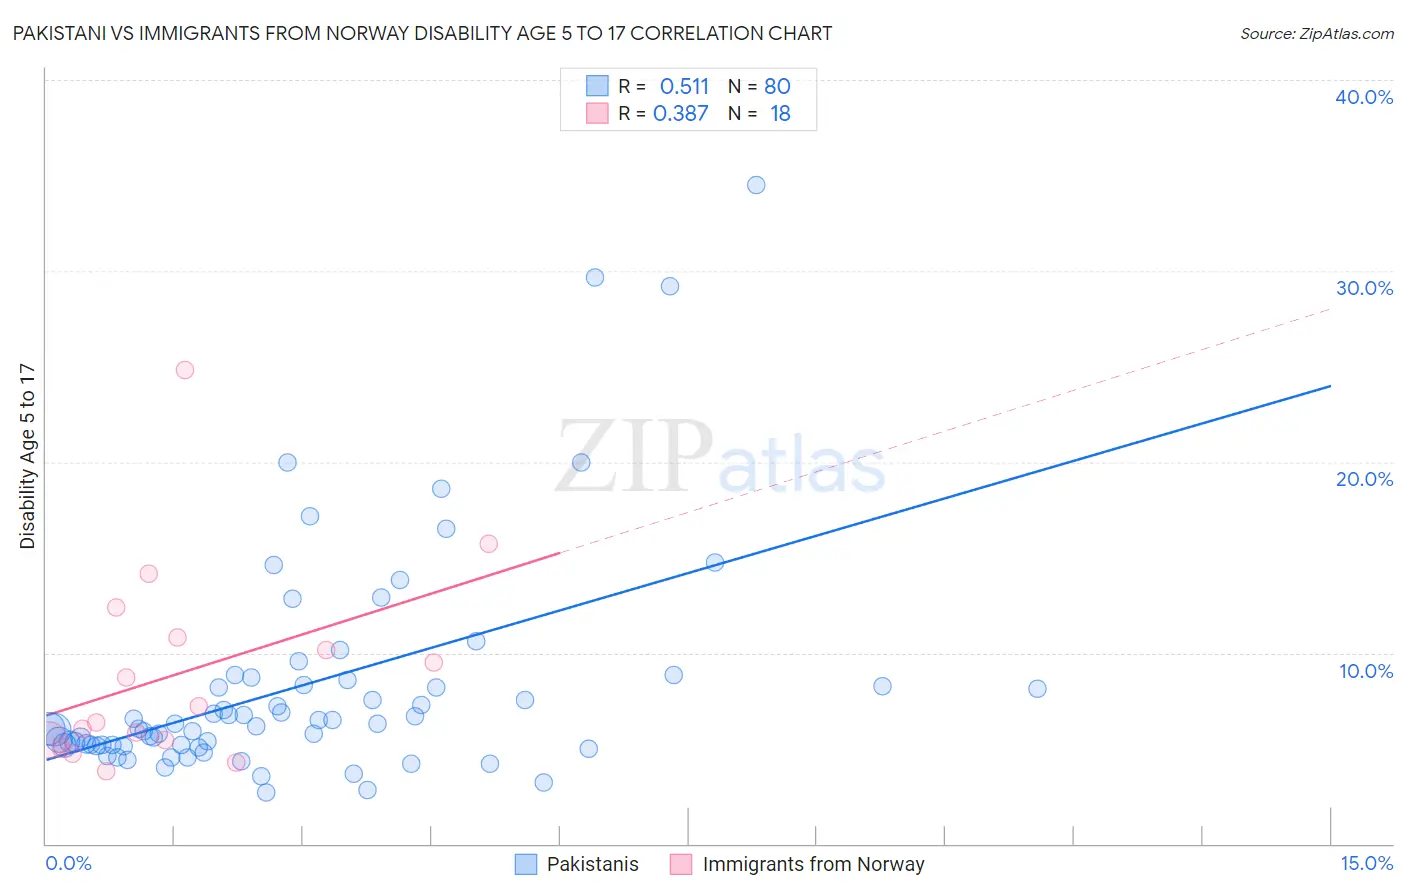
Pakistani vs Immigrants from Norway Disability Age 5 to 17 Correlation Chart
The statistical analysis conducted on geographies consisting of 333,128,103 people shows a substantial positive correlation between the proportion of Pakistanis and percentage of population with a disability between the ages 5 and 17 in the United States with a correlation coefficient (R) of 0.511 and weighted average of 5.5%. Similarly, the statistical analysis conducted on geographies consisting of 116,209,294 people shows a mild positive correlation between the proportion of Immigrants from Norway and percentage of population with a disability between the ages 5 and 17 in the United States with a correlation coefficient (R) of 0.387 and weighted average of 5.6%, a difference of 2.1%.
Disability Age 5 to 17 Correlation Summary
| Measurement | Pakistani | Immigrants from Norway |
| Minimum | 2.7% | 3.8% |
| Maximum | 34.5% | 24.8% |
| Range | 31.8% | 21.1% |
| Mean | 8.3% | 8.9% |
| Median | 6.2% | 6.8% |
| Interquartile 25% (IQ1) | 5.2% | 5.4% |
| Interquartile 75% (IQ3) | 8.5% | 10.8% |
| Interquartile Range (IQR) | 3.3% | 5.4% |
| Standard Deviation (Sample) | 5.9% | 5.3% |
| Standard Deviation (Population) | 5.9% | 5.1% |
Similar Demographics by Disability Age 5 to 17
Demographics Similar to Pakistanis by Disability Age 5 to 17
In terms of disability age 5 to 17, the demographic groups most similar to Pakistanis are Immigrants from Hungary (5.5%, a difference of 0.070%), Immigrants from Guatemala (5.5%, a difference of 0.080%), Colombian (5.5%, a difference of 0.090%), South American Indian (5.5%, a difference of 0.24%), and Albanian (5.5%, a difference of 0.37%).
| Demographics | Rating | Rank | Disability Age 5 to 17 |
| Navajo | 90.9 /100 | #137 | Exceptional 5.4% |
| Immigrants | Oceania | 90.8 /100 | #138 | Exceptional 5.4% |
| Belizeans | 90.8 /100 | #139 | Exceptional 5.4% |
| Immigrants | Netherlands | 90.5 /100 | #140 | Exceptional 5.4% |
| South American Indians | 89.3 /100 | #141 | Excellent 5.5% |
| Colombians | 88.0 /100 | #142 | Excellent 5.5% |
| Immigrants | Hungary | 87.9 /100 | #143 | Excellent 5.5% |
| Pakistanis | 87.3 /100 | #144 | Excellent 5.5% |
| Immigrants | Guatemala | 86.6 /100 | #145 | Excellent 5.5% |
| Albanians | 83.7 /100 | #146 | Excellent 5.5% |
| Immigrants | Albania | 83.1 /100 | #147 | Excellent 5.5% |
| Samoans | 81.9 /100 | #148 | Excellent 5.5% |
| Central Americans | 81.6 /100 | #149 | Excellent 5.5% |
| Guatemalans | 81.5 /100 | #150 | Excellent 5.5% |
| Estonians | 80.8 /100 | #151 | Excellent 5.5% |
Demographics Similar to Immigrants from Norway by Disability Age 5 to 17
In terms of disability age 5 to 17, the demographic groups most similar to Immigrants from Norway are Iraqi (5.6%, a difference of 0.020%), Serbian (5.6%, a difference of 0.080%), Immigrants from Iraq (5.6%, a difference of 0.090%), Immigrants from Burma/Myanmar (5.6%, a difference of 0.18%), and Ukrainian (5.6%, a difference of 0.21%).
| Demographics | Rating | Rank | Disability Age 5 to 17 |
| Zimbabweans | 67.2 /100 | #162 | Good 5.5% |
| Immigrants | Southern Europe | 64.0 /100 | #163 | Good 5.6% |
| Immigrants | Scotland | 61.9 /100 | #164 | Good 5.6% |
| Lebanese | 61.4 /100 | #165 | Good 5.6% |
| Greeks | 60.6 /100 | #166 | Good 5.6% |
| Immigrants | Burma/Myanmar | 59.3 /100 | #167 | Average 5.6% |
| Iraqis | 56.0 /100 | #168 | Average 5.6% |
| Immigrants | Norway | 55.7 /100 | #169 | Average 5.6% |
| Serbians | 54.0 /100 | #170 | Average 5.6% |
| Immigrants | Iraq | 53.9 /100 | #171 | Average 5.6% |
| Ukrainians | 51.5 /100 | #172 | Average 5.6% |
| Uruguayans | 51.0 /100 | #173 | Average 5.6% |
| Costa Ricans | 50.0 /100 | #174 | Average 5.6% |
| Shoshone | 49.4 /100 | #175 | Average 5.6% |
| Immigrants | Central America | 49.4 /100 | #176 | Average 5.6% |