White/Caucasian vs Immigrants from Norway Disability Age 5 to 17
COMPARE
White/Caucasian
Immigrants from Norway
Disability Age 5 to 17
Disability Age 5 to 17 Comparison
Whites/Caucasians
Immigrants from Norway
6.2%
DISABILITY AGE 5 TO 17
0.0/ 100
METRIC RATING
291st/ 347
METRIC RANK
5.6%
DISABILITY AGE 5 TO 17
55.7/ 100
METRIC RATING
169th/ 347
METRIC RANK
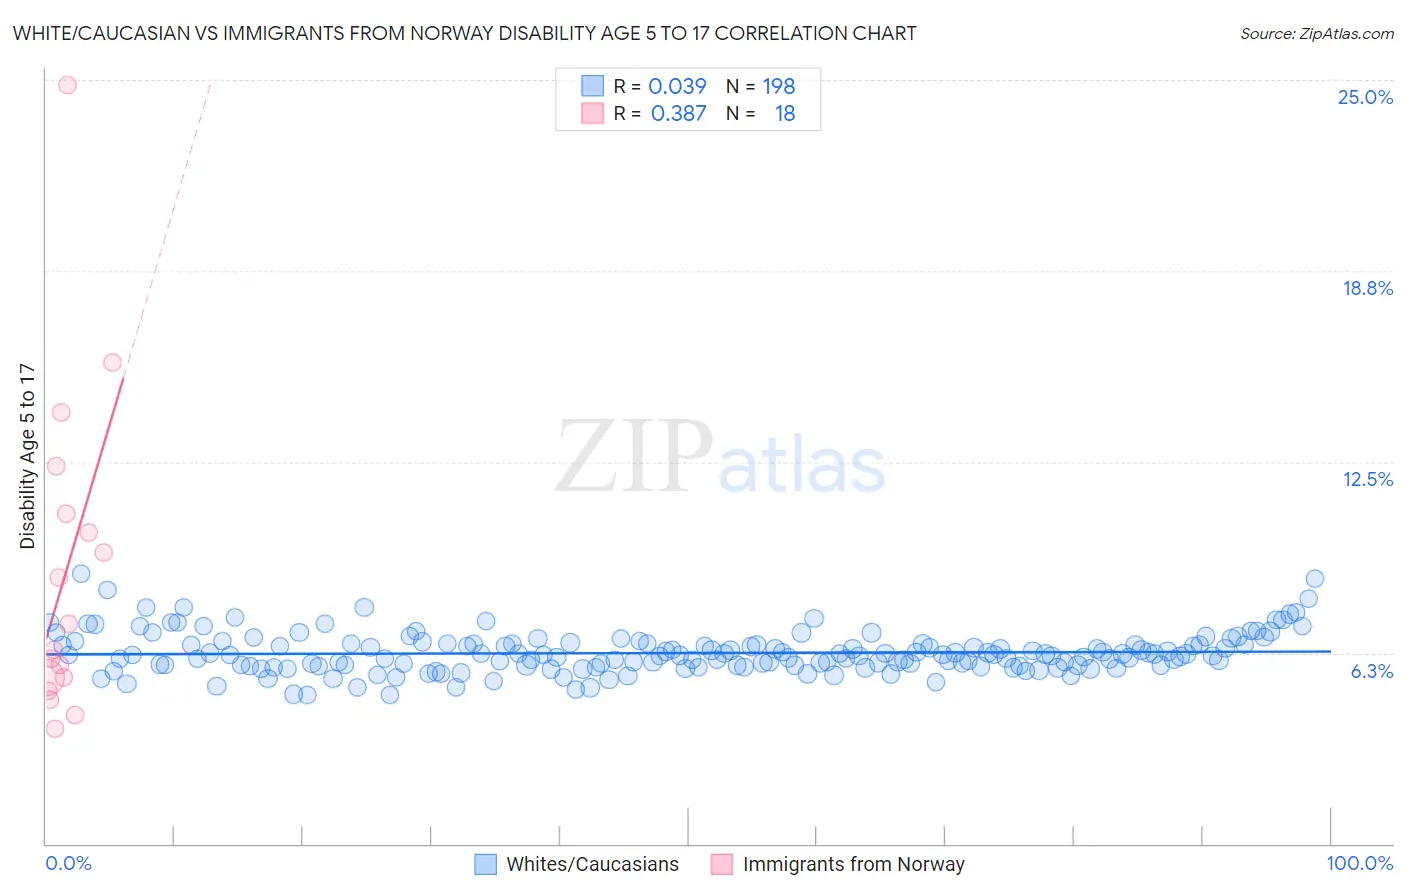
White/Caucasian vs Immigrants from Norway Disability Age 5 to 17 Correlation Chart
The statistical analysis conducted on geographies consisting of 566,464,467 people shows no correlation between the proportion of Whites/Caucasians and percentage of population with a disability between the ages 5 and 17 in the United States with a correlation coefficient (R) of 0.039 and weighted average of 6.2%. Similarly, the statistical analysis conducted on geographies consisting of 116,209,294 people shows a mild positive correlation between the proportion of Immigrants from Norway and percentage of population with a disability between the ages 5 and 17 in the United States with a correlation coefficient (R) of 0.387 and weighted average of 5.6%, a difference of 11.0%.
Disability Age 5 to 17 Correlation Summary
| Measurement | White/Caucasian | Immigrants from Norway |
| Minimum | 4.9% | 3.8% |
| Maximum | 8.8% | 24.8% |
| Range | 4.0% | 21.1% |
| Mean | 6.2% | 8.9% |
| Median | 6.2% | 6.8% |
| Interquartile 25% (IQ1) | 5.8% | 5.4% |
| Interquartile 75% (IQ3) | 6.6% | 10.8% |
| Interquartile Range (IQR) | 0.72% | 5.4% |
| Standard Deviation (Sample) | 0.66% | 5.3% |
| Standard Deviation (Population) | 0.66% | 5.1% |
Similar Demographics by Disability Age 5 to 17
Demographics Similar to Whites/Caucasians by Disability Age 5 to 17
In terms of disability age 5 to 17, the demographic groups most similar to Whites/Caucasians are Jamaican (6.2%, a difference of 0.15%), Yaqui (6.2%, a difference of 0.15%), Immigrants from Congo (6.2%, a difference of 0.15%), Immigrants from Senegal (6.2%, a difference of 0.24%), and Central American Indian (6.2%, a difference of 0.26%).
| Demographics | Rating | Rank | Disability Age 5 to 17 |
| Sub-Saharan Africans | 0.0 /100 | #284 | Tragic 6.2% |
| English | 0.0 /100 | #285 | Tragic 6.2% |
| Colville | 0.0 /100 | #286 | Tragic 6.2% |
| Pima | 0.0 /100 | #287 | Tragic 6.2% |
| Jamaicans | 0.0 /100 | #288 | Tragic 6.2% |
| Yaqui | 0.0 /100 | #289 | Tragic 6.2% |
| Immigrants | Congo | 0.0 /100 | #290 | Tragic 6.2% |
| Whites/Caucasians | 0.0 /100 | #291 | Tragic 6.2% |
| Immigrants | Senegal | 0.0 /100 | #292 | Tragic 6.2% |
| Central American Indians | 0.0 /100 | #293 | Tragic 6.2% |
| Irish | 0.0 /100 | #294 | Tragic 6.2% |
| Cree | 0.0 /100 | #295 | Tragic 6.2% |
| Spanish Americans | 0.0 /100 | #296 | Tragic 6.2% |
| Immigrants | Bahamas | 0.0 /100 | #297 | Tragic 6.2% |
| Lumbee | 0.0 /100 | #298 | Tragic 6.2% |
Demographics Similar to Immigrants from Norway by Disability Age 5 to 17
In terms of disability age 5 to 17, the demographic groups most similar to Immigrants from Norway are Iraqi (5.6%, a difference of 0.020%), Serbian (5.6%, a difference of 0.080%), Immigrants from Iraq (5.6%, a difference of 0.090%), Immigrants from Burma/Myanmar (5.6%, a difference of 0.18%), and Ukrainian (5.6%, a difference of 0.21%).
| Demographics | Rating | Rank | Disability Age 5 to 17 |
| Zimbabweans | 67.2 /100 | #162 | Good 5.5% |
| Immigrants | Southern Europe | 64.0 /100 | #163 | Good 5.6% |
| Immigrants | Scotland | 61.9 /100 | #164 | Good 5.6% |
| Lebanese | 61.4 /100 | #165 | Good 5.6% |
| Greeks | 60.6 /100 | #166 | Good 5.6% |
| Immigrants | Burma/Myanmar | 59.3 /100 | #167 | Average 5.6% |
| Iraqis | 56.0 /100 | #168 | Average 5.6% |
| Immigrants | Norway | 55.7 /100 | #169 | Average 5.6% |
| Serbians | 54.0 /100 | #170 | Average 5.6% |
| Immigrants | Iraq | 53.9 /100 | #171 | Average 5.6% |
| Ukrainians | 51.5 /100 | #172 | Average 5.6% |
| Uruguayans | 51.0 /100 | #173 | Average 5.6% |
| Costa Ricans | 50.0 /100 | #174 | Average 5.6% |
| Shoshone | 49.4 /100 | #175 | Average 5.6% |
| Immigrants | Central America | 49.4 /100 | #176 | Average 5.6% |