Pakistani vs Yugoslavian Disability Age 5 to 17
COMPARE
Pakistani
Yugoslavian
Disability Age 5 to 17
Disability Age 5 to 17 Comparison
Pakistanis
Yugoslavians
5.5%
DISABILITY AGE 5 TO 17
87.3/ 100
METRIC RATING
144th/ 347
METRIC RANK
5.8%
DISABILITY AGE 5 TO 17
9.1/ 100
METRIC RATING
211th/ 347
METRIC RANK
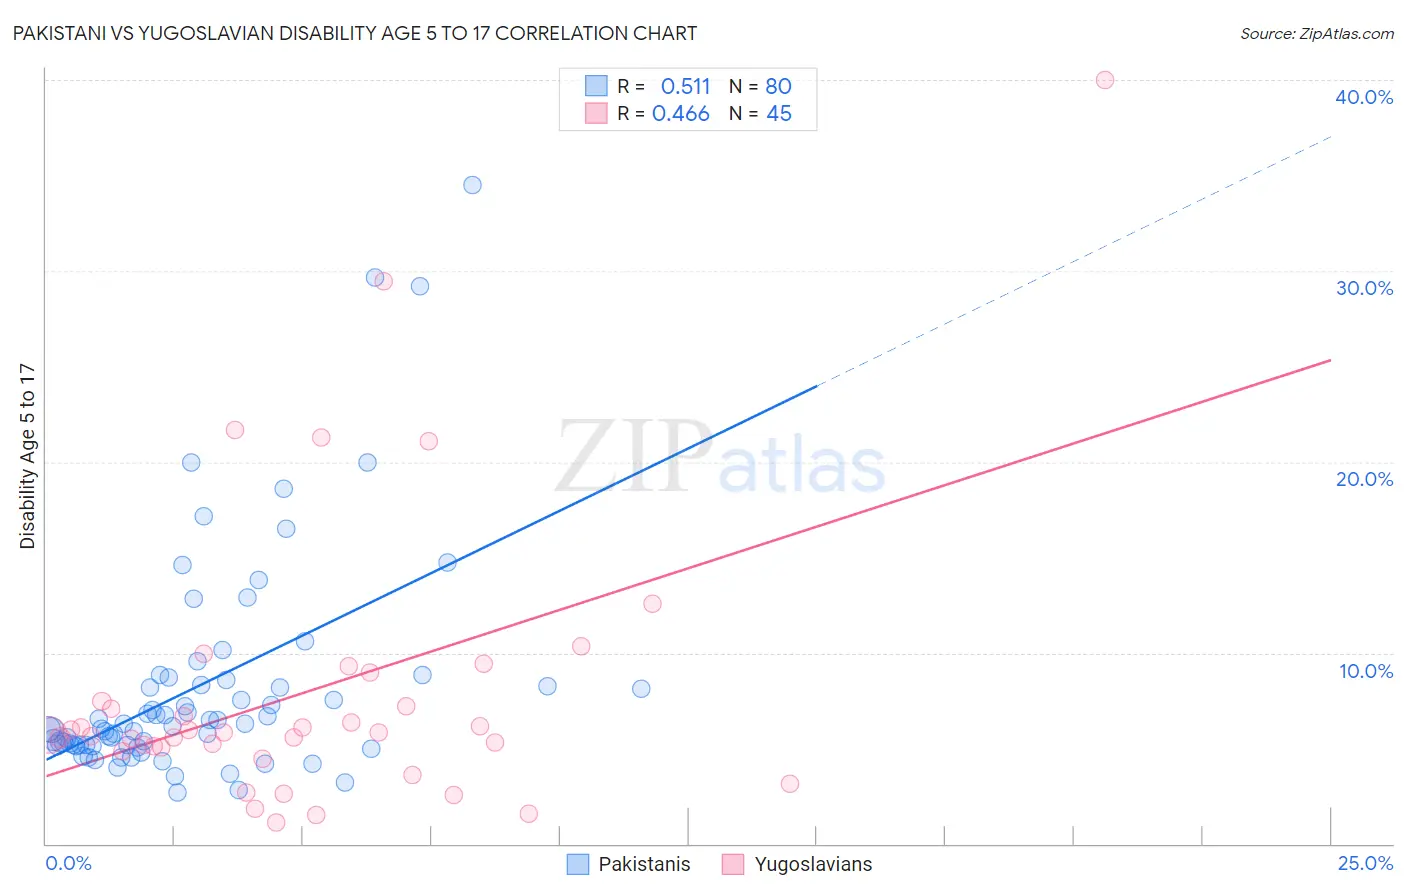
Pakistani vs Yugoslavian Disability Age 5 to 17 Correlation Chart
The statistical analysis conducted on geographies consisting of 333,128,103 people shows a substantial positive correlation between the proportion of Pakistanis and percentage of population with a disability between the ages 5 and 17 in the United States with a correlation coefficient (R) of 0.511 and weighted average of 5.5%. Similarly, the statistical analysis conducted on geographies consisting of 284,028,403 people shows a moderate positive correlation between the proportion of Yugoslavians and percentage of population with a disability between the ages 5 and 17 in the United States with a correlation coefficient (R) of 0.466 and weighted average of 5.8%, a difference of 5.3%.
Disability Age 5 to 17 Correlation Summary
| Measurement | Pakistani | Yugoslavian |
| Minimum | 2.7% | 1.1% |
| Maximum | 34.5% | 40.0% |
| Range | 31.8% | 38.9% |
| Mean | 8.3% | 8.0% |
| Median | 6.2% | 5.8% |
| Interquartile 25% (IQ1) | 5.2% | 4.9% |
| Interquartile 75% (IQ3) | 8.5% | 8.2% |
| Interquartile Range (IQR) | 3.3% | 3.3% |
| Standard Deviation (Sample) | 5.9% | 7.5% |
| Standard Deviation (Population) | 5.9% | 7.4% |
Similar Demographics by Disability Age 5 to 17
Demographics Similar to Pakistanis by Disability Age 5 to 17
In terms of disability age 5 to 17, the demographic groups most similar to Pakistanis are Immigrants from Hungary (5.5%, a difference of 0.070%), Immigrants from Guatemala (5.5%, a difference of 0.080%), Colombian (5.5%, a difference of 0.090%), South American Indian (5.5%, a difference of 0.24%), and Albanian (5.5%, a difference of 0.37%).
| Demographics | Rating | Rank | Disability Age 5 to 17 |
| Navajo | 90.9 /100 | #137 | Exceptional 5.4% |
| Immigrants | Oceania | 90.8 /100 | #138 | Exceptional 5.4% |
| Belizeans | 90.8 /100 | #139 | Exceptional 5.4% |
| Immigrants | Netherlands | 90.5 /100 | #140 | Exceptional 5.4% |
| South American Indians | 89.3 /100 | #141 | Excellent 5.5% |
| Colombians | 88.0 /100 | #142 | Excellent 5.5% |
| Immigrants | Hungary | 87.9 /100 | #143 | Excellent 5.5% |
| Pakistanis | 87.3 /100 | #144 | Excellent 5.5% |
| Immigrants | Guatemala | 86.6 /100 | #145 | Excellent 5.5% |
| Albanians | 83.7 /100 | #146 | Excellent 5.5% |
| Immigrants | Albania | 83.1 /100 | #147 | Excellent 5.5% |
| Samoans | 81.9 /100 | #148 | Excellent 5.5% |
| Central Americans | 81.6 /100 | #149 | Excellent 5.5% |
| Guatemalans | 81.5 /100 | #150 | Excellent 5.5% |
| Estonians | 80.8 /100 | #151 | Excellent 5.5% |
Demographics Similar to Yugoslavians by Disability Age 5 to 17
In terms of disability age 5 to 17, the demographic groups most similar to Yugoslavians are Immigrants from Haiti (5.8%, a difference of 0.050%), Immigrants from Panama (5.8%, a difference of 0.070%), Immigrants from Uganda (5.8%, a difference of 0.080%), Kenyan (5.8%, a difference of 0.12%), and Immigrants from Cameroon (5.8%, a difference of 0.12%).
| Demographics | Rating | Rank | Disability Age 5 to 17 |
| Paiute | 11.2 /100 | #204 | Poor 5.7% |
| Trinidadians and Tobagonians | 10.8 /100 | #205 | Poor 5.7% |
| Immigrants | Africa | 10.8 /100 | #206 | Poor 5.7% |
| Moroccans | 10.4 /100 | #207 | Poor 5.7% |
| Kenyans | 10.0 /100 | #208 | Poor 5.8% |
| Immigrants | Uganda | 9.7 /100 | #209 | Tragic 5.8% |
| Immigrants | Haiti | 9.5 /100 | #210 | Tragic 5.8% |
| Yugoslavians | 9.1 /100 | #211 | Tragic 5.8% |
| Immigrants | Panama | 8.7 /100 | #212 | Tragic 5.8% |
| Immigrants | Cameroon | 8.3 /100 | #213 | Tragic 5.8% |
| Immigrants | Morocco | 8.3 /100 | #214 | Tragic 5.8% |
| Swedes | 8.1 /100 | #215 | Tragic 5.8% |
| Nigerians | 7.5 /100 | #216 | Tragic 5.8% |
| Czechs | 7.4 /100 | #217 | Tragic 5.8% |
| Immigrants | Sierra Leone | 7.1 /100 | #218 | Tragic 5.8% |