Cheyenne vs Immigrants from Norway Disability Age 5 to 17
COMPARE
Cheyenne
Immigrants from Norway
Disability Age 5 to 17
Disability Age 5 to 17 Comparison
Cheyenne
Immigrants from Norway
6.0%
DISABILITY AGE 5 TO 17
0.2/ 100
METRIC RATING
274th/ 347
METRIC RANK
5.6%
DISABILITY AGE 5 TO 17
55.7/ 100
METRIC RATING
169th/ 347
METRIC RANK
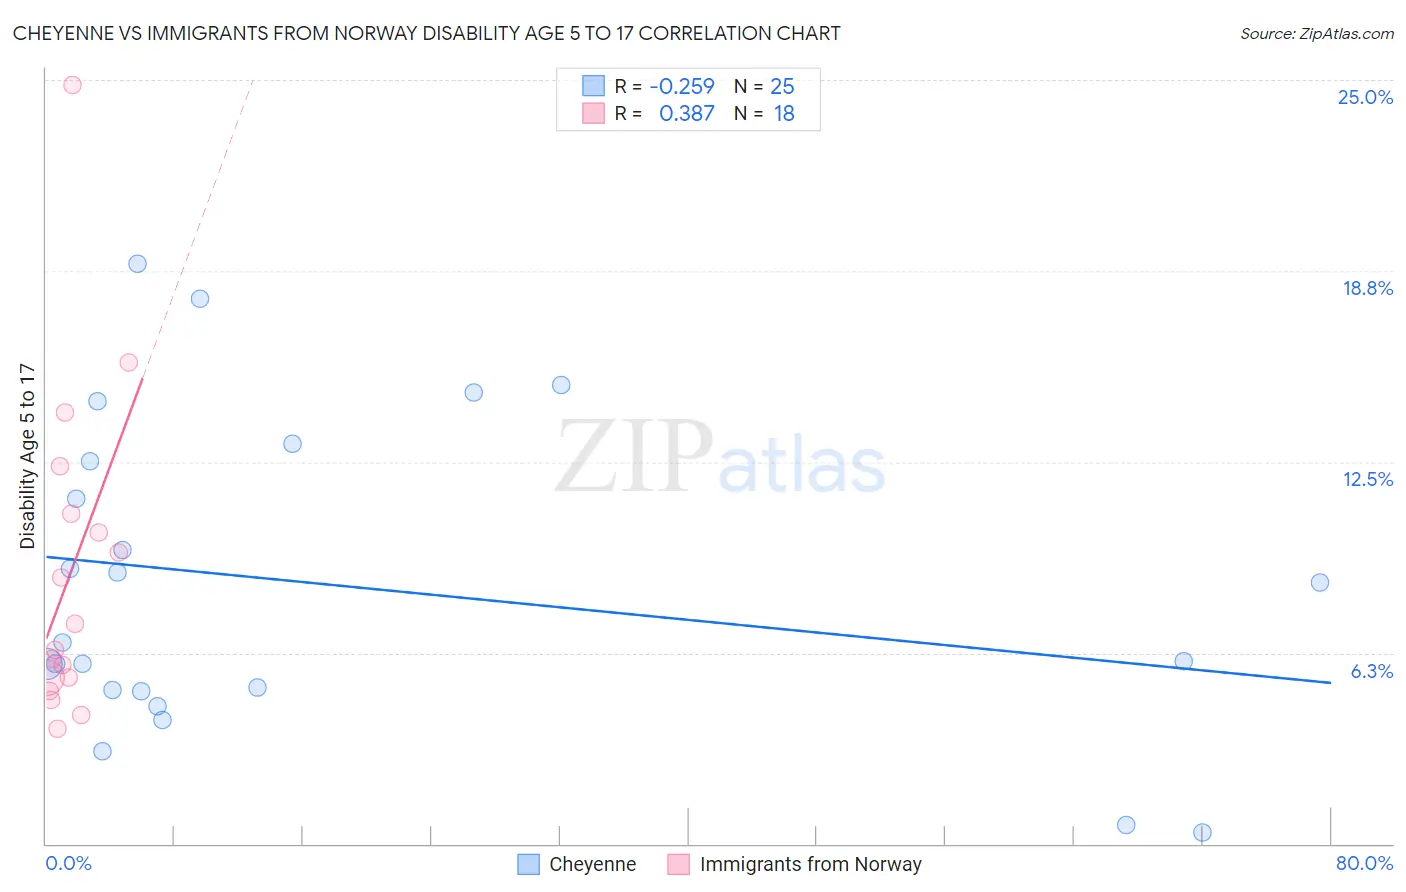
Cheyenne vs Immigrants from Norway Disability Age 5 to 17 Correlation Chart
The statistical analysis conducted on geographies consisting of 80,502,855 people shows a weak negative correlation between the proportion of Cheyenne and percentage of population with a disability between the ages 5 and 17 in the United States with a correlation coefficient (R) of -0.259 and weighted average of 6.0%. Similarly, the statistical analysis conducted on geographies consisting of 116,209,294 people shows a mild positive correlation between the proportion of Immigrants from Norway and percentage of population with a disability between the ages 5 and 17 in the United States with a correlation coefficient (R) of 0.387 and weighted average of 5.6%, a difference of 8.2%.
Disability Age 5 to 17 Correlation Summary
| Measurement | Cheyenne | Immigrants from Norway |
| Minimum | 0.39% | 3.8% |
| Maximum | 19.0% | 24.8% |
| Range | 18.6% | 21.1% |
| Mean | 8.5% | 8.9% |
| Median | 6.6% | 6.8% |
| Interquartile 25% (IQ1) | 5.0% | 5.4% |
| Interquartile 75% (IQ3) | 12.8% | 10.8% |
| Interquartile Range (IQR) | 7.8% | 5.4% |
| Standard Deviation (Sample) | 5.1% | 5.3% |
| Standard Deviation (Population) | 5.0% | 5.1% |
Similar Demographics by Disability Age 5 to 17
Demographics Similar to Cheyenne by Disability Age 5 to 17
In terms of disability age 5 to 17, the demographic groups most similar to Cheyenne are Alaska Native (6.0%, a difference of 0.11%), Dutch (6.0%, a difference of 0.11%), Finnish (6.0%, a difference of 0.16%), Immigrants from Zaire (6.0%, a difference of 0.19%), and Japanese (6.1%, a difference of 0.21%).
| Demographics | Rating | Rank | Disability Age 5 to 17 |
| Spanish | 0.5 /100 | #267 | Tragic 6.0% |
| Sioux | 0.4 /100 | #268 | Tragic 6.0% |
| Liberians | 0.4 /100 | #269 | Tragic 6.0% |
| Immigrants | Somalia | 0.4 /100 | #270 | Tragic 6.0% |
| Immigrants | Zaire | 0.2 /100 | #271 | Tragic 6.0% |
| Finns | 0.2 /100 | #272 | Tragic 6.0% |
| Alaska Natives | 0.2 /100 | #273 | Tragic 6.0% |
| Cheyenne | 0.2 /100 | #274 | Tragic 6.0% |
| Dutch | 0.2 /100 | #275 | Tragic 6.0% |
| Japanese | 0.1 /100 | #276 | Tragic 6.1% |
| Puget Sound Salish | 0.1 /100 | #277 | Tragic 6.1% |
| Immigrants | Liberia | 0.1 /100 | #278 | Tragic 6.1% |
| Immigrants | Jamaica | 0.1 /100 | #279 | Tragic 6.1% |
| Portuguese | 0.1 /100 | #280 | Tragic 6.1% |
| Scottish | 0.0 /100 | #281 | Tragic 6.1% |
Demographics Similar to Immigrants from Norway by Disability Age 5 to 17
In terms of disability age 5 to 17, the demographic groups most similar to Immigrants from Norway are Iraqi (5.6%, a difference of 0.020%), Serbian (5.6%, a difference of 0.080%), Immigrants from Iraq (5.6%, a difference of 0.090%), Immigrants from Burma/Myanmar (5.6%, a difference of 0.18%), and Ukrainian (5.6%, a difference of 0.21%).
| Demographics | Rating | Rank | Disability Age 5 to 17 |
| Zimbabweans | 67.2 /100 | #162 | Good 5.5% |
| Immigrants | Southern Europe | 64.0 /100 | #163 | Good 5.6% |
| Immigrants | Scotland | 61.9 /100 | #164 | Good 5.6% |
| Lebanese | 61.4 /100 | #165 | Good 5.6% |
| Greeks | 60.6 /100 | #166 | Good 5.6% |
| Immigrants | Burma/Myanmar | 59.3 /100 | #167 | Average 5.6% |
| Iraqis | 56.0 /100 | #168 | Average 5.6% |
| Immigrants | Norway | 55.7 /100 | #169 | Average 5.6% |
| Serbians | 54.0 /100 | #170 | Average 5.6% |
| Immigrants | Iraq | 53.9 /100 | #171 | Average 5.6% |
| Ukrainians | 51.5 /100 | #172 | Average 5.6% |
| Uruguayans | 51.0 /100 | #173 | Average 5.6% |
| Costa Ricans | 50.0 /100 | #174 | Average 5.6% |
| Shoshone | 49.4 /100 | #175 | Average 5.6% |
| Immigrants | Central America | 49.4 /100 | #176 | Average 5.6% |