Immigrants from Switzerland vs Immigrants from Norway Disability Age 5 to 17
COMPARE
Immigrants from Switzerland
Immigrants from Norway
Disability Age 5 to 17
Disability Age 5 to 17 Comparison
Immigrants from Switzerland
Immigrants from Norway
5.2%
DISABILITY AGE 5 TO 17
99.8/ 100
METRIC RATING
61st/ 347
METRIC RANK
5.6%
DISABILITY AGE 5 TO 17
55.7/ 100
METRIC RATING
169th/ 347
METRIC RANK
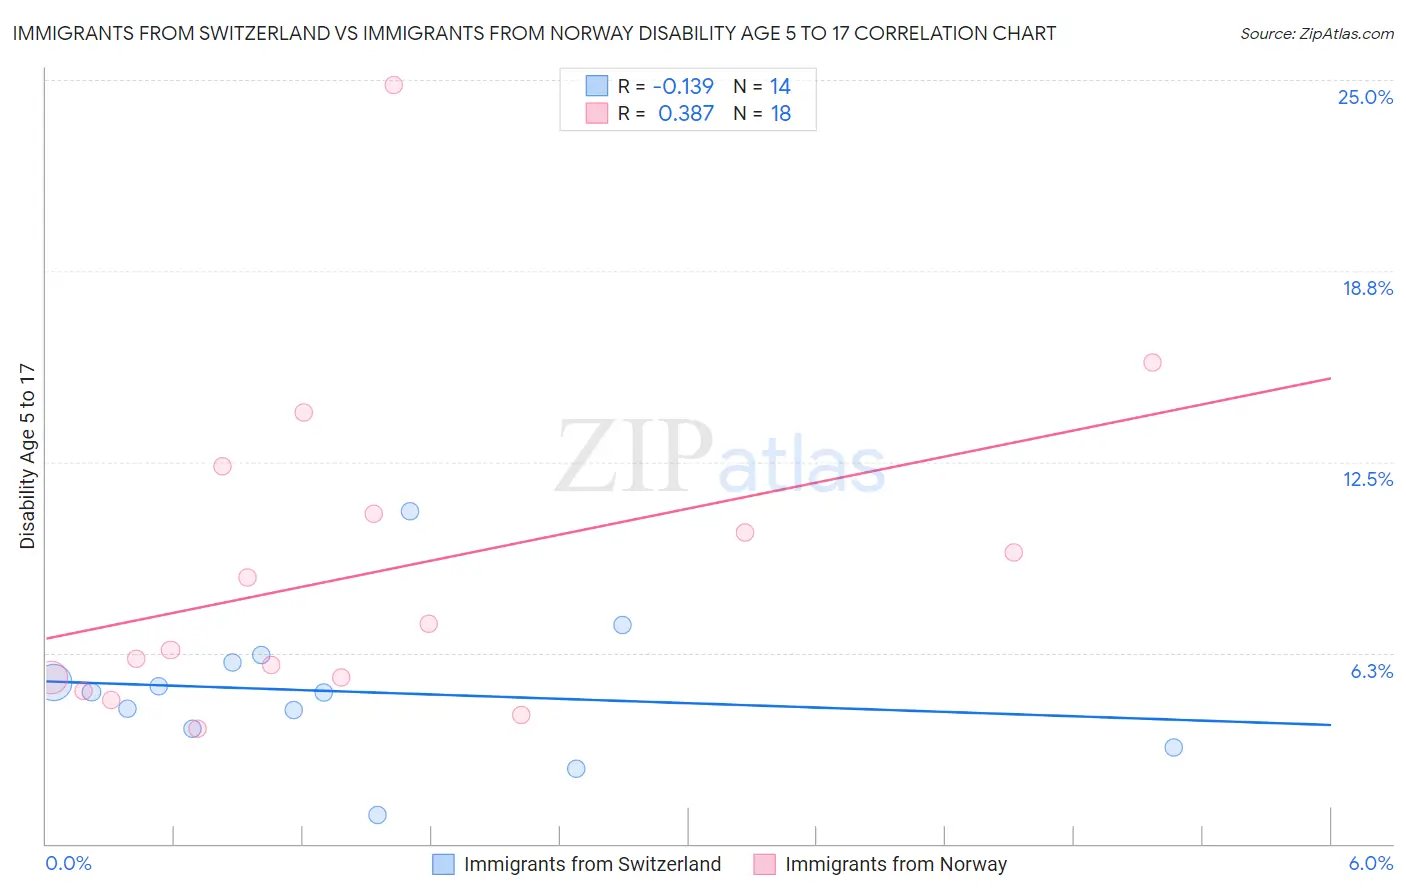
Immigrants from Switzerland vs Immigrants from Norway Disability Age 5 to 17 Correlation Chart
The statistical analysis conducted on geographies consisting of 147,257,747 people shows a poor negative correlation between the proportion of Immigrants from Switzerland and percentage of population with a disability between the ages 5 and 17 in the United States with a correlation coefficient (R) of -0.139 and weighted average of 5.2%. Similarly, the statistical analysis conducted on geographies consisting of 116,209,294 people shows a mild positive correlation between the proportion of Immigrants from Norway and percentage of population with a disability between the ages 5 and 17 in the United States with a correlation coefficient (R) of 0.387 and weighted average of 5.6%, a difference of 8.1%.
Disability Age 5 to 17 Correlation Summary
| Measurement | Immigrants from Switzerland | Immigrants from Norway |
| Minimum | 0.94% | 3.8% |
| Maximum | 10.9% | 24.8% |
| Range | 10.0% | 21.1% |
| Mean | 5.0% | 8.9% |
| Median | 5.0% | 6.8% |
| Interquartile 25% (IQ1) | 3.8% | 5.4% |
| Interquartile 75% (IQ3) | 5.9% | 10.8% |
| Interquartile Range (IQR) | 2.2% | 5.4% |
| Standard Deviation (Sample) | 2.3% | 5.3% |
| Standard Deviation (Population) | 2.2% | 5.1% |
Similar Demographics by Disability Age 5 to 17
Demographics Similar to Immigrants from Switzerland by Disability Age 5 to 17
In terms of disability age 5 to 17, the demographic groups most similar to Immigrants from Switzerland are Immigrants from Ireland (5.2%, a difference of 0.090%), Immigrants from Bangladesh (5.2%, a difference of 0.20%), Immigrants from South Eastern Asia (5.2%, a difference of 0.23%), Immigrants from Greece (5.2%, a difference of 0.24%), and Palestinian (5.2%, a difference of 0.28%).
| Demographics | Rating | Rank | Disability Age 5 to 17 |
| Paraguayans | 99.9 /100 | #54 | Exceptional 5.1% |
| Laotians | 99.9 /100 | #55 | Exceptional 5.1% |
| Immigrants | Turkey | 99.9 /100 | #56 | Exceptional 5.1% |
| Immigrants | Poland | 99.9 /100 | #57 | Exceptional 5.1% |
| Immigrants | Ukraine | 99.9 /100 | #58 | Exceptional 5.1% |
| Immigrants | North Macedonia | 99.9 /100 | #59 | Exceptional 5.1% |
| Immigrants | Eastern Europe | 99.9 /100 | #60 | Exceptional 5.1% |
| Immigrants | Switzerland | 99.8 /100 | #61 | Exceptional 5.2% |
| Immigrants | Ireland | 99.8 /100 | #62 | Exceptional 5.2% |
| Immigrants | Bangladesh | 99.8 /100 | #63 | Exceptional 5.2% |
| Immigrants | South Eastern Asia | 99.8 /100 | #64 | Exceptional 5.2% |
| Immigrants | Greece | 99.8 /100 | #65 | Exceptional 5.2% |
| Palestinians | 99.8 /100 | #66 | Exceptional 5.2% |
| Macedonians | 99.8 /100 | #67 | Exceptional 5.2% |
| Immigrants | Syria | 99.7 /100 | #68 | Exceptional 5.2% |
Demographics Similar to Immigrants from Norway by Disability Age 5 to 17
In terms of disability age 5 to 17, the demographic groups most similar to Immigrants from Norway are Iraqi (5.6%, a difference of 0.020%), Serbian (5.6%, a difference of 0.080%), Immigrants from Iraq (5.6%, a difference of 0.090%), Immigrants from Burma/Myanmar (5.6%, a difference of 0.18%), and Ukrainian (5.6%, a difference of 0.21%).
| Demographics | Rating | Rank | Disability Age 5 to 17 |
| Zimbabweans | 67.2 /100 | #162 | Good 5.5% |
| Immigrants | Southern Europe | 64.0 /100 | #163 | Good 5.6% |
| Immigrants | Scotland | 61.9 /100 | #164 | Good 5.6% |
| Lebanese | 61.4 /100 | #165 | Good 5.6% |
| Greeks | 60.6 /100 | #166 | Good 5.6% |
| Immigrants | Burma/Myanmar | 59.3 /100 | #167 | Average 5.6% |
| Iraqis | 56.0 /100 | #168 | Average 5.6% |
| Immigrants | Norway | 55.7 /100 | #169 | Average 5.6% |
| Serbians | 54.0 /100 | #170 | Average 5.6% |
| Immigrants | Iraq | 53.9 /100 | #171 | Average 5.6% |
| Ukrainians | 51.5 /100 | #172 | Average 5.6% |
| Uruguayans | 51.0 /100 | #173 | Average 5.6% |
| Costa Ricans | 50.0 /100 | #174 | Average 5.6% |
| Shoshone | 49.4 /100 | #175 | Average 5.6% |
| Immigrants | Central America | 49.4 /100 | #176 | Average 5.6% |