Pakistani vs Immigrants from Norway In Labor Force | Age 45-54
COMPARE
Pakistani
Immigrants from Norway
In Labor Force | Age 45-54
In Labor Force | Age 45-54 Comparison
Pakistanis
Immigrants from Norway
82.8%
IN LABOR FORCE | AGE 45-54
53.2/ 100
METRIC RATING
170th/ 347
METRIC RANK
82.5%
IN LABOR FORCE | AGE 45-54
20.7/ 100
METRIC RATING
194th/ 347
METRIC RANK
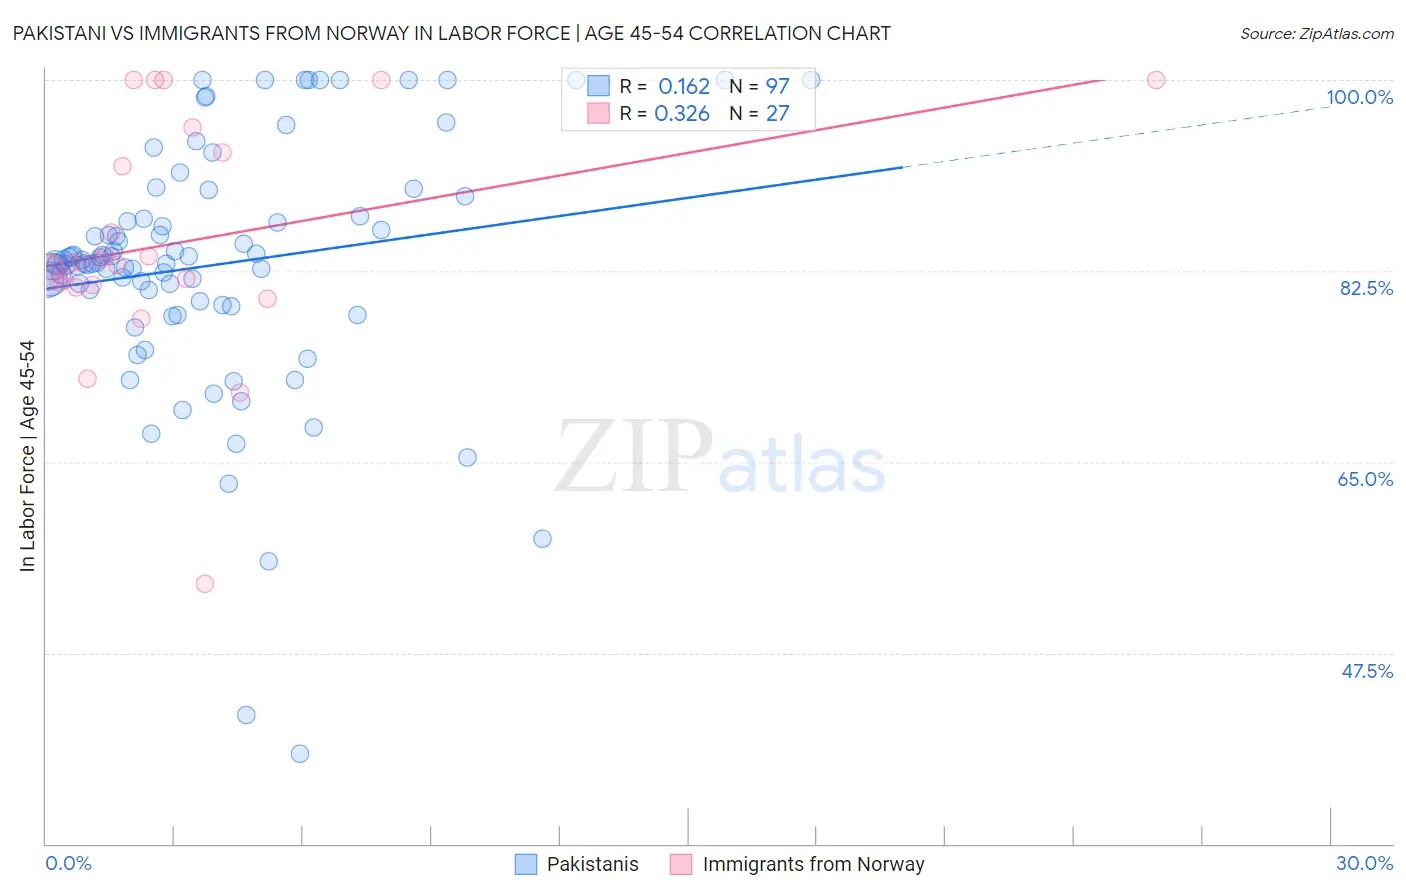
Pakistani vs Immigrants from Norway In Labor Force | Age 45-54 Correlation Chart
The statistical analysis conducted on geographies consisting of 335,175,573 people shows a poor positive correlation between the proportion of Pakistanis and labor force participation rate among population between the ages 45 and 54 in the United States with a correlation coefficient (R) of 0.162 and weighted average of 82.8%. Similarly, the statistical analysis conducted on geographies consisting of 116,685,095 people shows a mild positive correlation between the proportion of Immigrants from Norway and labor force participation rate among population between the ages 45 and 54 in the United States with a correlation coefficient (R) of 0.326 and weighted average of 82.5%, a difference of 0.32%.
In Labor Force | Age 45-54 Correlation Summary
| Measurement | Pakistani | Immigrants from Norway |
| Minimum | 38.2% | 53.8% |
| Maximum | 100.0% | 100.0% |
| Range | 61.8% | 46.2% |
| Mean | 83.0% | 85.1% |
| Median | 83.2% | 83.2% |
| Interquartile 25% (IQ1) | 79.5% | 81.3% |
| Interquartile 75% (IQ3) | 87.4% | 93.4% |
| Interquartile Range (IQR) | 7.9% | 12.1% |
| Standard Deviation (Sample) | 11.4% | 10.4% |
| Standard Deviation (Population) | 11.3% | 10.2% |
Similar Demographics by In Labor Force | Age 45-54
Demographics Similar to Pakistanis by In Labor Force | Age 45-54
In terms of in labor force | age 45-54, the demographic groups most similar to Pakistanis are Immigrants from Zaire (82.8%, a difference of 0.0%), Immigrants from Western Africa (82.8%, a difference of 0.010%), Icelander (82.8%, a difference of 0.010%), Immigrants from South Africa (82.8%, a difference of 0.020%), and Swiss (82.8%, a difference of 0.030%).
| Demographics | Rating | Rank | In Labor Force | Age 45-54 |
| Dutch | 61.7 /100 | #163 | Good 82.8% |
| German Russians | 61.3 /100 | #164 | Good 82.8% |
| Immigrants | Sudan | 59.9 /100 | #165 | Average 82.8% |
| Immigrants | South Eastern Asia | 57.4 /100 | #166 | Average 82.8% |
| Swiss | 56.5 /100 | #167 | Average 82.8% |
| Immigrants | South Africa | 55.8 /100 | #168 | Average 82.8% |
| Immigrants | Western Africa | 54.1 /100 | #169 | Average 82.8% |
| Pakistanis | 53.2 /100 | #170 | Average 82.8% |
| Immigrants | Zaire | 52.9 /100 | #171 | Average 82.8% |
| Icelanders | 51.8 /100 | #172 | Average 82.8% |
| Nicaraguans | 50.3 /100 | #173 | Average 82.8% |
| Costa Ricans | 50.0 /100 | #174 | Average 82.8% |
| Immigrants | Liberia | 47.9 /100 | #175 | Average 82.7% |
| Northern Europeans | 46.9 /100 | #176 | Average 82.7% |
| Immigrants | Nicaragua | 44.6 /100 | #177 | Average 82.7% |
Demographics Similar to Immigrants from Norway by In Labor Force | Age 45-54
In terms of in labor force | age 45-54, the demographic groups most similar to Immigrants from Norway are Immigrants from Iraq (82.5%, a difference of 0.0%), Australian (82.5%, a difference of 0.0%), Immigrants from Canada (82.5%, a difference of 0.010%), Armenian (82.5%, a difference of 0.030%), and Immigrants from North America (82.5%, a difference of 0.030%).
| Demographics | Rating | Rank | In Labor Force | Age 45-54 |
| Immigrants | Costa Rica | 28.3 /100 | #187 | Fair 82.6% |
| South Africans | 28.0 /100 | #188 | Fair 82.6% |
| Syrians | 26.0 /100 | #189 | Fair 82.6% |
| British | 25.7 /100 | #190 | Fair 82.6% |
| Armenians | 23.2 /100 | #191 | Fair 82.5% |
| Immigrants | Iraq | 20.9 /100 | #192 | Fair 82.5% |
| Australians | 20.8 /100 | #193 | Fair 82.5% |
| Immigrants | Norway | 20.7 /100 | #194 | Fair 82.5% |
| Immigrants | Canada | 20.0 /100 | #195 | Fair 82.5% |
| Immigrants | North America | 18.8 /100 | #196 | Poor 82.5% |
| Lebanese | 18.2 /100 | #197 | Poor 82.5% |
| Immigrants | Denmark | 17.9 /100 | #198 | Poor 82.5% |
| Moroccans | 15.7 /100 | #199 | Poor 82.5% |
| French Canadians | 15.4 /100 | #200 | Poor 82.5% |
| Canadians | 15.1 /100 | #201 | Poor 82.4% |