Pakistani vs Immigrants from Bulgaria Disability Age 5 to 17
COMPARE
Pakistani
Immigrants from Bulgaria
Disability Age 5 to 17
Disability Age 5 to 17 Comparison
Pakistanis
Immigrants from Bulgaria
5.5%
DISABILITY AGE 5 TO 17
87.3/ 100
METRIC RATING
144th/ 347
METRIC RANK
5.4%
DISABILITY AGE 5 TO 17
94.0/ 100
METRIC RATING
130th/ 347
METRIC RANK
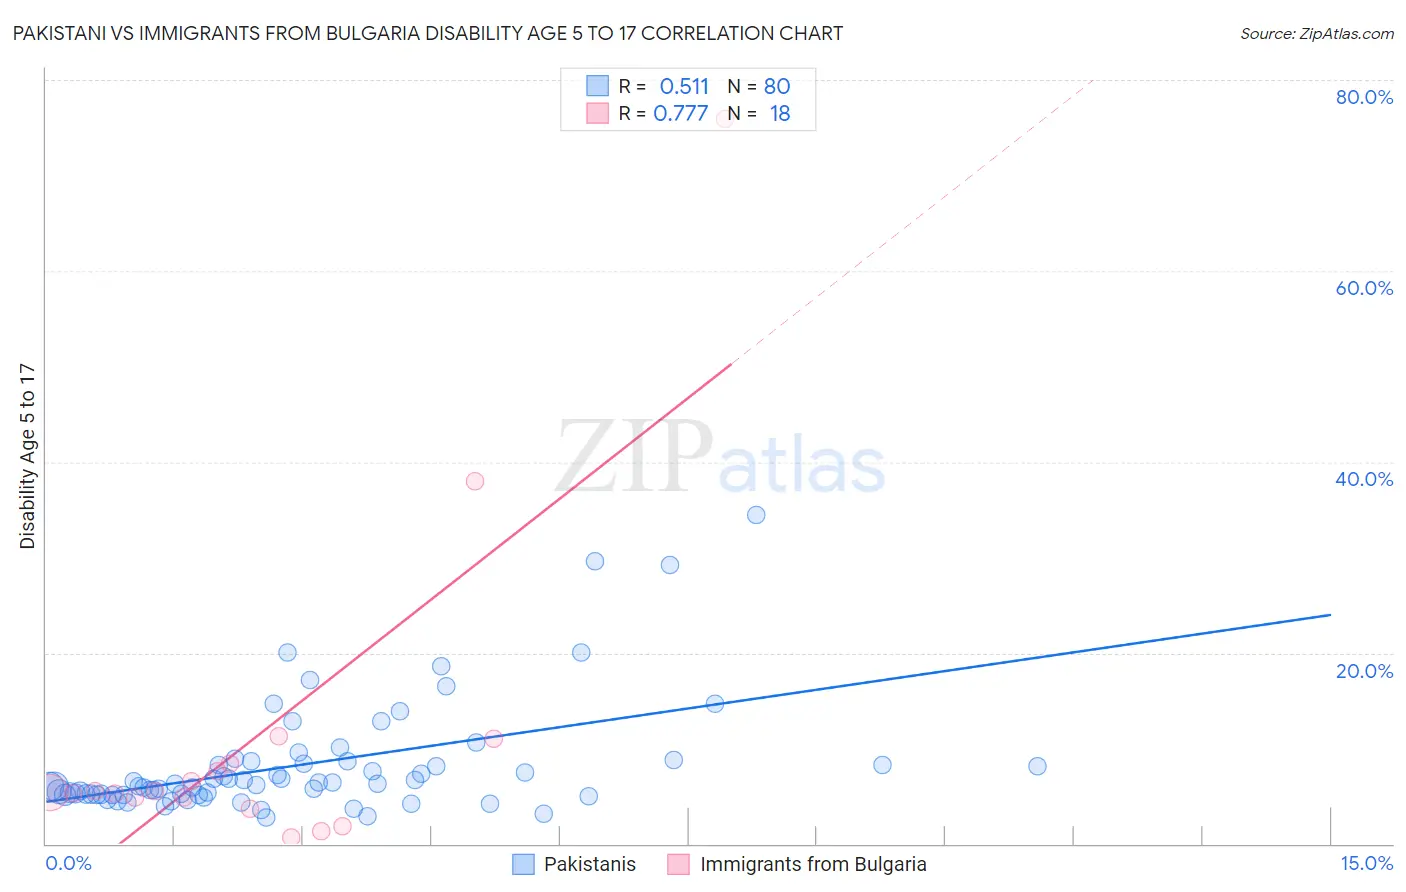
Pakistani vs Immigrants from Bulgaria Disability Age 5 to 17 Correlation Chart
The statistical analysis conducted on geographies consisting of 333,128,103 people shows a substantial positive correlation between the proportion of Pakistanis and percentage of population with a disability between the ages 5 and 17 in the United States with a correlation coefficient (R) of 0.511 and weighted average of 5.5%. Similarly, the statistical analysis conducted on geographies consisting of 171,828,354 people shows a strong positive correlation between the proportion of Immigrants from Bulgaria and percentage of population with a disability between the ages 5 and 17 in the United States with a correlation coefficient (R) of 0.777 and weighted average of 5.4%, a difference of 1.1%.
Disability Age 5 to 17 Correlation Summary
| Measurement | Pakistani | Immigrants from Bulgaria |
| Minimum | 2.7% | 0.67% |
| Maximum | 34.5% | 76.0% |
| Range | 31.8% | 75.3% |
| Mean | 8.3% | 11.3% |
| Median | 6.2% | 5.4% |
| Interquartile 25% (IQ1) | 5.2% | 4.8% |
| Interquartile 75% (IQ3) | 8.5% | 8.4% |
| Interquartile Range (IQR) | 3.3% | 3.6% |
| Standard Deviation (Sample) | 5.9% | 18.1% |
| Standard Deviation (Population) | 5.9% | 17.6% |
Demographics Similar to Pakistanis and Immigrants from Bulgaria by Disability Age 5 to 17
In terms of disability age 5 to 17, the demographic groups most similar to Pakistanis are Immigrants from Hungary (5.5%, a difference of 0.070%), Immigrants from Guatemala (5.5%, a difference of 0.080%), Colombian (5.5%, a difference of 0.090%), South American Indian (5.5%, a difference of 0.24%), and Albanian (5.5%, a difference of 0.37%). Similarly, the demographic groups most similar to Immigrants from Bulgaria are Romanian (5.4%, a difference of 0.020%), Immigrants from Venezuela (5.4%, a difference of 0.11%), Latvian (5.4%, a difference of 0.23%), Arab (5.4%, a difference of 0.23%), and Immigrants from Colombia (5.4%, a difference of 0.25%).
| Demographics | Rating | Rank | Disability Age 5 to 17 |
| Latvians | 95.0 /100 | #127 | Exceptional 5.4% |
| Immigrants | Venezuela | 94.5 /100 | #128 | Exceptional 5.4% |
| Romanians | 94.1 /100 | #129 | Exceptional 5.4% |
| Immigrants | Bulgaria | 94.0 /100 | #130 | Exceptional 5.4% |
| Arabs | 92.9 /100 | #131 | Exceptional 5.4% |
| Immigrants | Colombia | 92.9 /100 | #132 | Exceptional 5.4% |
| Venezuelans | 92.7 /100 | #133 | Exceptional 5.4% |
| Yuman | 92.3 /100 | #134 | Exceptional 5.4% |
| Immigrants | Belize | 91.7 /100 | #135 | Exceptional 5.4% |
| Immigrants | Denmark | 91.4 /100 | #136 | Exceptional 5.4% |
| Navajo | 90.9 /100 | #137 | Exceptional 5.4% |
| Immigrants | Oceania | 90.8 /100 | #138 | Exceptional 5.4% |
| Belizeans | 90.8 /100 | #139 | Exceptional 5.4% |
| Immigrants | Netherlands | 90.5 /100 | #140 | Exceptional 5.4% |
| South American Indians | 89.3 /100 | #141 | Excellent 5.5% |
| Colombians | 88.0 /100 | #142 | Excellent 5.5% |
| Immigrants | Hungary | 87.9 /100 | #143 | Excellent 5.5% |
| Pakistanis | 87.3 /100 | #144 | Excellent 5.5% |
| Immigrants | Guatemala | 86.6 /100 | #145 | Excellent 5.5% |
| Albanians | 83.7 /100 | #146 | Excellent 5.5% |
| Immigrants | Albania | 83.1 /100 | #147 | Excellent 5.5% |