Pakistani vs Haitian Disability Age 5 to 17
COMPARE
Pakistani
Haitian
Disability Age 5 to 17
Disability Age 5 to 17 Comparison
Pakistanis
Haitians
5.5%
DISABILITY AGE 5 TO 17
87.3/ 100
METRIC RATING
144th/ 347
METRIC RANK
5.8%
DISABILITY AGE 5 TO 17
4.8/ 100
METRIC RATING
228th/ 347
METRIC RANK
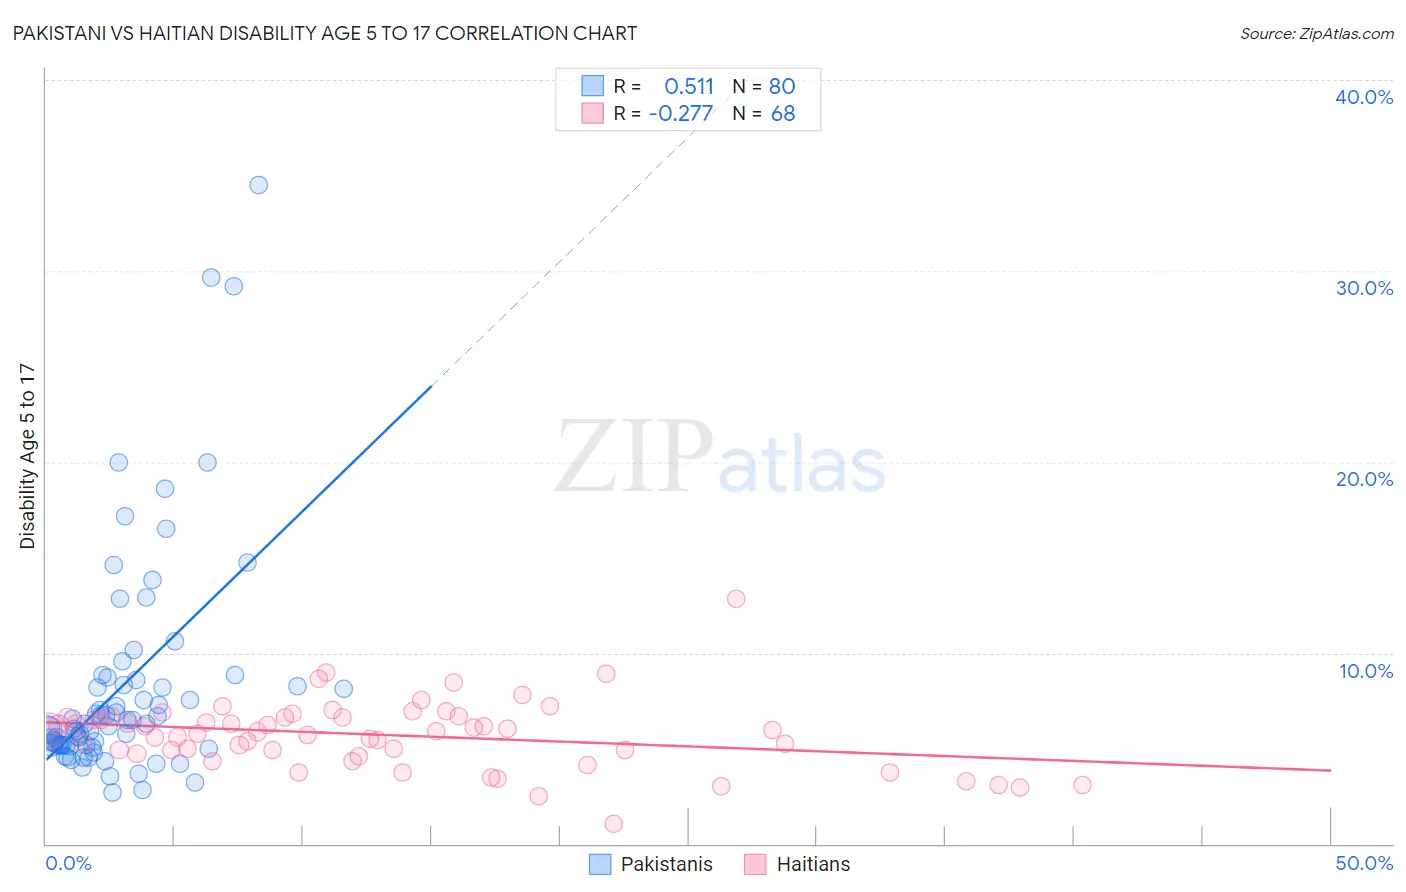
Pakistani vs Haitian Disability Age 5 to 17 Correlation Chart
The statistical analysis conducted on geographies consisting of 333,128,103 people shows a substantial positive correlation between the proportion of Pakistanis and percentage of population with a disability between the ages 5 and 17 in the United States with a correlation coefficient (R) of 0.511 and weighted average of 5.5%. Similarly, the statistical analysis conducted on geographies consisting of 286,241,081 people shows a weak negative correlation between the proportion of Haitians and percentage of population with a disability between the ages 5 and 17 in the United States with a correlation coefficient (R) of -0.277 and weighted average of 5.8%, a difference of 6.2%.
Disability Age 5 to 17 Correlation Summary
| Measurement | Pakistani | Haitian |
| Minimum | 2.7% | 1.1% |
| Maximum | 34.5% | 12.8% |
| Range | 31.8% | 11.7% |
| Mean | 8.3% | 5.7% |
| Median | 6.2% | 5.9% |
| Interquartile 25% (IQ1) | 5.2% | 4.8% |
| Interquartile 75% (IQ3) | 8.5% | 6.6% |
| Interquartile Range (IQR) | 3.3% | 1.8% |
| Standard Deviation (Sample) | 5.9% | 1.8% |
| Standard Deviation (Population) | 5.9% | 1.8% |
Similar Demographics by Disability Age 5 to 17
Demographics Similar to Pakistanis by Disability Age 5 to 17
In terms of disability age 5 to 17, the demographic groups most similar to Pakistanis are Immigrants from Hungary (5.5%, a difference of 0.070%), Immigrants from Guatemala (5.5%, a difference of 0.080%), Colombian (5.5%, a difference of 0.090%), South American Indian (5.5%, a difference of 0.24%), and Albanian (5.5%, a difference of 0.37%).
| Demographics | Rating | Rank | Disability Age 5 to 17 |
| Navajo | 90.9 /100 | #137 | Exceptional 5.4% |
| Immigrants | Oceania | 90.8 /100 | #138 | Exceptional 5.4% |
| Belizeans | 90.8 /100 | #139 | Exceptional 5.4% |
| Immigrants | Netherlands | 90.5 /100 | #140 | Exceptional 5.4% |
| South American Indians | 89.3 /100 | #141 | Excellent 5.5% |
| Colombians | 88.0 /100 | #142 | Excellent 5.5% |
| Immigrants | Hungary | 87.9 /100 | #143 | Excellent 5.5% |
| Pakistanis | 87.3 /100 | #144 | Excellent 5.5% |
| Immigrants | Guatemala | 86.6 /100 | #145 | Excellent 5.5% |
| Albanians | 83.7 /100 | #146 | Excellent 5.5% |
| Immigrants | Albania | 83.1 /100 | #147 | Excellent 5.5% |
| Samoans | 81.9 /100 | #148 | Excellent 5.5% |
| Central Americans | 81.6 /100 | #149 | Excellent 5.5% |
| Guatemalans | 81.5 /100 | #150 | Excellent 5.5% |
| Estonians | 80.8 /100 | #151 | Excellent 5.5% |
Demographics Similar to Haitians by Disability Age 5 to 17
In terms of disability age 5 to 17, the demographic groups most similar to Haitians are Bangladeshi (5.8%, a difference of 0.010%), Ghanaian (5.8%, a difference of 0.020%), Swiss (5.8%, a difference of 0.080%), European (5.8%, a difference of 0.090%), and British West Indian (5.8%, a difference of 0.16%).
| Demographics | Rating | Rank | Disability Age 5 to 17 |
| Lithuanians | 6.7 /100 | #221 | Tragic 5.8% |
| Immigrants | Sudan | 6.7 /100 | #222 | Tragic 5.8% |
| Alsatians | 6.0 /100 | #223 | Tragic 5.8% |
| Mexicans | 5.7 /100 | #224 | Tragic 5.8% |
| Guamanians/Chamorros | 5.6 /100 | #225 | Tragic 5.8% |
| British West Indians | 5.4 /100 | #226 | Tragic 5.8% |
| Swiss | 5.1 /100 | #227 | Tragic 5.8% |
| Haitians | 4.8 /100 | #228 | Tragic 5.8% |
| Bangladeshis | 4.8 /100 | #229 | Tragic 5.8% |
| Ghanaians | 4.7 /100 | #230 | Tragic 5.8% |
| Europeans | 4.5 /100 | #231 | Tragic 5.8% |
| Immigrants | Laos | 3.8 /100 | #232 | Tragic 5.8% |
| Immigrants | West Indies | 3.5 /100 | #233 | Tragic 5.8% |
| Immigrants | Kenya | 3.4 /100 | #234 | Tragic 5.8% |
| Malaysians | 3.4 /100 | #235 | Tragic 5.8% |