Immigrants from Ghana vs Kiowa Male Disability

COMPARE

Immigrants from Ghana
Race
Ancestry
AfghanAfricanAlaska NativeAlaskan AthabascanAlbanianAleutAlsatianAmericanApacheArabArapahoArgentineanArmenianAssyrian/Chaldean/SyriacAustralianAustrianBahamianBangladeshiBarbadianBasqueBelgianBelizeanBermudanBhutaneseBlackfeetBolivianBrazilianBritishBritish West IndianBulgarianBurmeseCajunCambodianCanadianCape VerdeanCarpatho RusynCelticCentral AmericanCentral American IndianCherokeeCheyenneChickasawChileanChineseChippewaChoctawColombianColvilleComancheCosta RicanCreeCreekCroatianCrowCubanCypriotCzechCzechoslovakianDanishDelawareDominicanDutchDutch West IndianEastern EuropeanEcuadorianEgyptianEnglishEstonianEthiopianEuropeanFijianFilipinoFinnishFrenchFrench American IndianFrench CanadianGermanGerman RussianGhanaianGreekGuamanian/ChamorroGuatemalanGuyaneseHaitianHmongHonduranHopiHoumaHungarianIcelanderIndian (Asian)IndonesianInupiatIranianIraqiIrishIroquoisIsraeliItalianJamaicanJapaneseJordanianKenyanKoreanLaotianLatvianLebaneseLiberianLithuanianLumbeeLuxembourgerMacedonianMalaysianMalteseMarshalleseMenomineeMexicanMexican American IndianMongolianMoroccanNative HawaiianNavajoNepaleseNew ZealanderNicaraguanNigerianNorthern EuropeanNorwegianOkinawanOsageOttawaPaiutePakistaniPalestinianPanamanianParaguayanPennsylvania GermanPeruvianPimaPolishPortuguesePotawatomiPuebloPuerto RicanPuget Sound SalishRomanianRussianSalvadoranSamoanScandinavianScotch-IrishScottishSeminoleSenegaleseSerbianShoshoneSierra LeoneanSiouxSlavicSlovakSloveneSomaliSouth AfricanSouth AmericanSouth American IndianSoviet UnionSpaniardSpanishSpanish AmericanSpanish American IndianSri LankanSubsaharan AfricanSudaneseSwedishSwissSyrianTaiwaneseThaiTlingit-HaidaTohono O'OdhamTonganTrinidadian and TobagonianTsimshianTurkishU.S. Virgin IslanderUgandanUkrainianUruguayanUteVenezuelanVietnameseWelshWest IndianYakamaYaquiYugoslavianYumanYup'ikZimbabwean
Immigration
NonimmigrantsImmigrantsAfghanistanAfricaAlbaniaArgentinaArmeniaAsiaAustraliaAustriaBahamasBangladeshBarbadosBelarusBelgiumBelizeBoliviaBosnia and HerzegovinaBrazilBulgariaBurma/MyanmarCabo VerdeCambodiaCameroonCanadaCaribbeanCentral AmericaChileChinaColombiaCongoCosta RicaCroatiaCubaCzechoslovakiaDenmarkDominicaDominican RepublicEastern AfricaEastern AsiaEastern EuropeEcuadorEgyptEl SalvadorEnglandEritreaEthiopiaEuropeFijiFranceGermanyGhanaGreeceGrenadaGuatemalaGuyanaHaitiHondurasHong KongHungaryIndiaIndonesiaIranIraqIrelandIsraelItalyJamaicaJapanJordanKazakhstanKenyaKoreaKuwaitLaosLatin AmericaLatviaLebanonLiberiaLithuaniaMalaysiaMexicoMicronesiaMiddle AfricaMoldovaMoroccoNepalNetherlandsNicaraguaNigeriaNorth AmericaNorth MacedoniaNorthern AfricaNorthern EuropeNorwayOceaniaPakistanPanamaPeruPhilippinesPolandPortugalRomaniaRussiaSaudi ArabiaScotlandSenegalSerbiaSierra LeoneSingaporeSomaliaSouth AfricaSouth AmericaSouth Central AsiaSouth Eastern AsiaSouthern EuropeSpainSri LankaSt. Vincent and the GrenadinesSudanSwedenSwitzerlandSyriaTaiwanThailandTrinidad and TobagoTurkeyUgandaUkraineUruguayUzbekistanVenezuelaVietnamWest IndiesWestern AfricaWestern AsiaWestern EuropeYemenZaireZimbabweAzores
Kiowa
Race
Ancestry
AfghanAfricanAlaska NativeAlaskan AthabascanAlbanianAleutAlsatianAmericanApacheArabArapahoArgentineanArmenianAssyrian/Chaldean/SyriacAustralianAustrianBahamianBangladeshiBarbadianBasqueBelgianBelizeanBermudanBhutaneseBlackfeetBolivianBrazilianBritishBritish West IndianBulgarianBurmeseCajunCambodianCanadianCape VerdeanCarpatho RusynCelticCentral AmericanCentral American IndianCherokeeCheyenneChickasawChileanChineseChippewaChoctawColombianColvilleComancheCosta RicanCreeCreekCroatianCrowCubanCypriotCzechCzechoslovakianDanishDelawareDominicanDutchDutch West IndianEastern EuropeanEcuadorianEgyptianEnglishEstonianEthiopianEuropeanFijianFilipinoFinnishFrenchFrench American IndianFrench CanadianGermanGerman RussianGhanaianGreekGuamanian/ChamorroGuatemalanGuyaneseHaitianHmongHonduranHopiHoumaHungarianIcelanderIndian (Asian)IndonesianInupiatIranianIraqiIrishIroquoisIsraeliItalianJamaicanJapaneseJordanianKenyanKiowaKoreanLaotianLatvianLebaneseLiberianLithuanianLumbeeLuxembourgerMacedonianMalaysianMalteseMarshalleseMenomineeMexicanMexican American IndianMongolianMoroccanNative HawaiianNavajoNepaleseNew ZealanderNicaraguanNigerianNorthern EuropeanNorwegianOkinawanOsageOttawaPaiutePakistaniPalestinianPanamanianParaguayanPennsylvania GermanPeruvianPimaPolishPortuguesePotawatomiPuebloPuerto RicanPuget Sound SalishRomanianRussianSalvadoranSamoanScandinavianScotch-IrishScottishSeminoleSenegaleseSerbianShoshoneSierra LeoneanSiouxSlavicSlovakSloveneSomaliSouth AfricanSouth AmericanSouth American IndianSoviet UnionSpaniardSpanishSpanish AmericanSpanish American IndianSri LankanSubsaharan AfricanSudaneseSwedishSwissSyrianTaiwaneseThaiTlingit-HaidaTohono O'OdhamTonganTrinidadian and TobagonianTsimshianTurkishU.S. Virgin IslanderUgandanUkrainianUruguayanUteVenezuelanVietnameseWelshWest IndianYakamaYaquiYugoslavianYumanYup'ikZimbabwean
Immigration
NonimmigrantsImmigrantsAfghanistanAfricaAlbaniaArgentinaArmeniaAsiaAustraliaAustriaBahamasBangladeshBarbadosBelarusBelgiumBelizeBoliviaBosnia and HerzegovinaBrazilBulgariaBurma/MyanmarCabo VerdeCambodiaCameroonCanadaCaribbeanCentral AmericaChileChinaColombiaCongoCosta RicaCroatiaCubaCzechoslovakiaDenmarkDominicaDominican RepublicEastern AfricaEastern AsiaEastern EuropeEcuadorEgyptEl SalvadorEnglandEritreaEthiopiaEuropeFijiFranceGermanyGreeceGrenadaGuatemalaGuyanaHaitiHondurasHong KongHungaryIndiaIndonesiaIranIraqIrelandIsraelItalyJamaicaJapanJordanKazakhstanKenyaKoreaKuwaitLaosLatin AmericaLatviaLebanonLiberiaLithuaniaMalaysiaMexicoMicronesiaMiddle AfricaMoldovaMoroccoNepalNetherlandsNicaraguaNigeriaNorth AmericaNorth MacedoniaNorthern AfricaNorthern EuropeNorwayOceaniaPakistanPanamaPeruPhilippinesPolandPortugalRomaniaRussiaSaudi ArabiaScotlandSenegalSerbiaSierra LeoneSingaporeSomaliaSouth AfricaSouth AmericaSouth Central AsiaSouth Eastern AsiaSouthern EuropeSpainSri LankaSt. Vincent and the GrenadinesSudanSwedenSwitzerlandSyriaTaiwanThailandTrinidad and TobagoTurkeyUgandaUkraineUruguayUzbekistanVenezuelaVietnamWest IndiesWestern AfricaWestern AsiaWestern EuropeYemenZaireZimbabweAzores
Male Disability
Income
Poverty
Unemployment
Labor Participation
Family Structure
Vehicle Availability
Education Level
Disability

Male Disability Comparison

Immigrants from Ghana

Kiowa

Excellent
Tragic
10.9%
MALE DISABILITY
89.0/ 100
METRIC RATING
122nd/ 347
METRIC RANK
15.4%
MALE DISABILITY
0.0/ 100
METRIC RATING
342nd/ 347
METRIC RANK

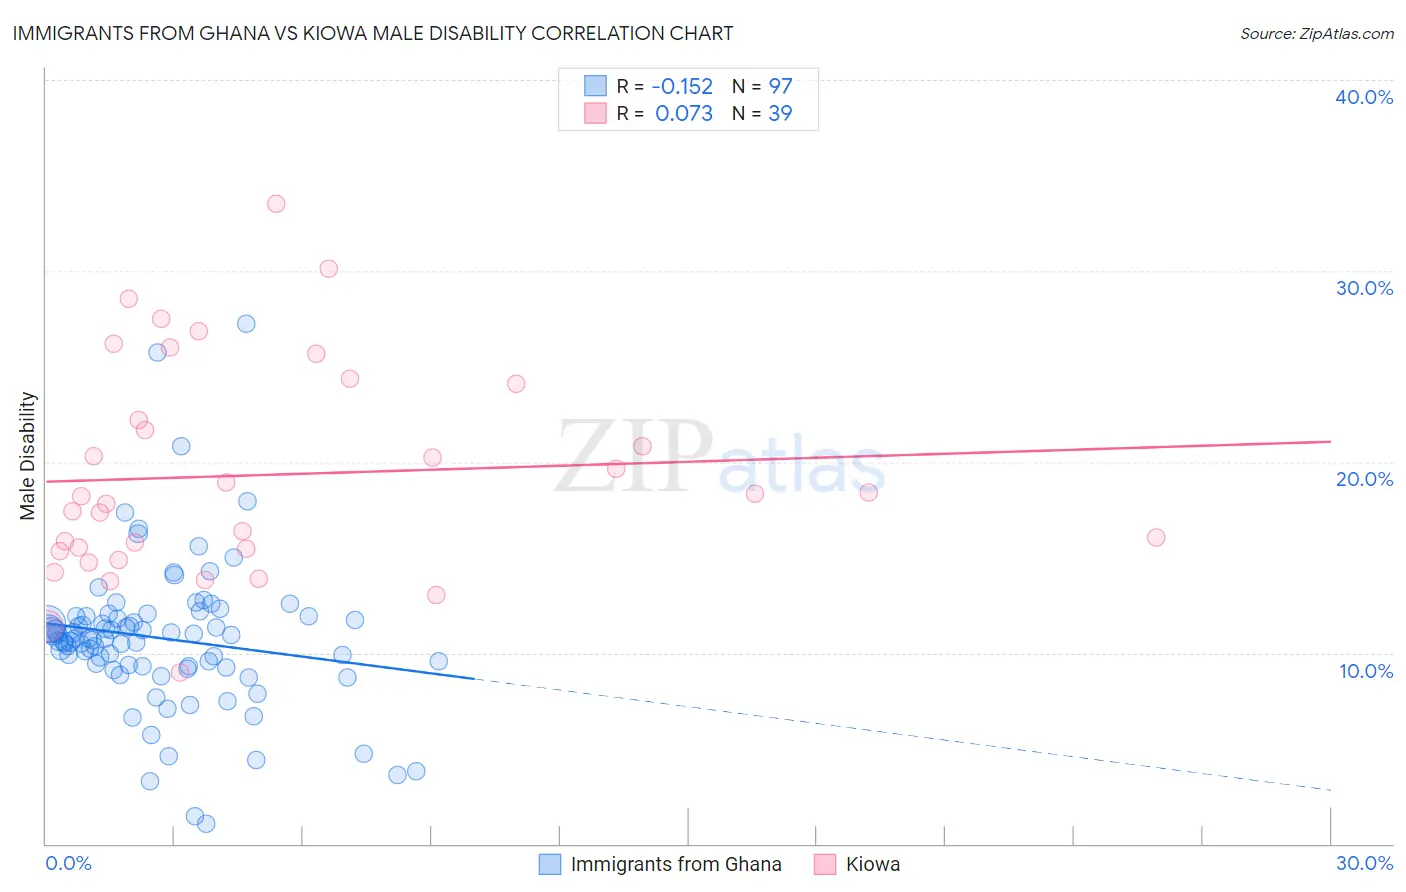
Immigrants from Ghana vs Kiowa Male Disability Correlation Chart

The statistical analysis conducted on geographies consisting of 199,919,905 people shows a poor negative correlation between the proportion of Immigrants from Ghana and percentage of males with a disability in the United States with a correlation coefficient (R) of -0.152 and weighted average of 10.9%. Similarly, the statistical analysis conducted on geographies consisting of 56,098,760 people shows a slight positive correlation between the proportion of Kiowa and percentage of males with a disability in the United States with a correlation coefficient (R) of 0.073 and weighted average of 15.4%, a difference of 41.7%.
Immigrants from Ghana vs Kiowa Male Disability

Male Disability Correlation Summary

MeasurementImmigrants from GhanaKiowa
Minimum1.1%9.0%
Maximum27.2%33.5%
Range26.2%24.5%
Mean10.8%19.3%
Median10.8%18.2%
Interquartile 25% (IQ1)9.3%15.3%
Interquartile 75% (IQ3)11.9%24.1%
Interquartile Range (IQR)2.6%8.8%
Standard Deviation (Sample)3.9%5.6%
Standard Deviation (Population)3.9%5.5%

Similar Demographics by Male Disability

Demographics Similar to Immigrants from Ghana by Male Disability

In terms of male disability, the demographic groups most similar to Immigrants from Ghana are Immigrants from South Eastern Asia (10.9%, a difference of 0.010%), Immigrants from Africa (10.9%, a difference of 0.060%), Immigrants from Czechoslovakia (10.9%, a difference of 0.090%), South American Indian (10.9%, a difference of 0.14%), and Immigrants from North Macedonia (10.9%, a difference of 0.14%).
DemographicsRating | RankMale Disability
Immigrants | Barbados
92.2
/100
|
#115
Exceptional
10.8%
Immigrants | South Africa
91.8
/100
|
#116
Exceptional
10.8%
Eastern Europeans
90.6
/100
|
#117
Exceptional
10.9%
Immigrants | Cuba
90.2
/100
|
#118
Exceptional
10.9%
Armenians
90.1
/100
|
#119
Exceptional
10.9%
Immigrants | Africa
89.4
/100
|
#120
Excellent
10.9%
Immigrants | South Eastern Asia
89.2
/100
|
#121
Excellent
10.9%
Immigrants | Ghana
89.0
/100
|
#122
Excellent
10.9%
Immigrants | Czechoslovakia
88.4
/100
|
#123
Excellent
10.9%
South American Indians
88.1
/100
|
#124
Excellent
10.9%
Immigrants | North Macedonia
88.1
/100
|
#125
Excellent
10.9%
Immigrants | Trinidad and Tobago
86.9
/100
|
#126
Excellent
10.9%
Immigrants | Ukraine
86.8
/100
|
#127
Excellent
10.9%
Immigrants | Latvia
85.5
/100
|
#128
Excellent
10.9%
Immigrants | Philippines
85.4
/100
|
#129
Excellent
10.9%

Demographics Similar to Kiowa by Male Disability

In terms of male disability, the demographic groups most similar to Kiowa are Choctaw (15.4%, a difference of 0.19%), Creek (15.5%, a difference of 0.66%), Puerto Rican (15.6%, a difference of 0.79%), Tsimshian (15.6%, a difference of 1.1%), and Lumbee (15.2%, a difference of 1.3%).
DemographicsRating | RankMale Disability
Yuman
0.0
/100
|
#333
Tragic
14.7%
Cherokee
0.0
/100
|
#334
Tragic
14.8%
Dutch West Indians
0.0
/100
|
#335
Tragic
14.8%
Alaskan Athabascans
0.0
/100
|
#336
Tragic
14.9%
Menominee
0.0
/100
|
#337
Tragic
15.0%
Pueblo
0.0
/100
|
#338
Tragic
15.0%
Chickasaw
0.0
/100
|
#339
Tragic
15.1%
Lumbee
0.0
/100
|
#340
Tragic
15.2%
Choctaw
0.0
/100
|
#341
Tragic
15.4%
Kiowa
0.0
/100
|
#342
Tragic
15.4%
Creek
0.0
/100
|
#343
Tragic
15.5%
Puerto Ricans
0.0
/100
|
#344
Tragic
15.6%
Tsimshian
0.0
/100
|
#345
Tragic
15.6%
Colville
0.0
/100
|
#346
Tragic
16.5%
Houma
0.0
/100
|
#347
Tragic
17.4%