Guamanian/Chamorro vs Kiowa Male Disability
COMPARE
Guamanian/Chamorro
Kiowa
Male Disability
Male Disability Comparison
Guamanians/Chamorros
Kiowa
12.0%
MALE DISABILITY
0.5/ 100
METRIC RATING
253rd/ 347
METRIC RANK
15.4%
MALE DISABILITY
0.0/ 100
METRIC RATING
342nd/ 347
METRIC RANK
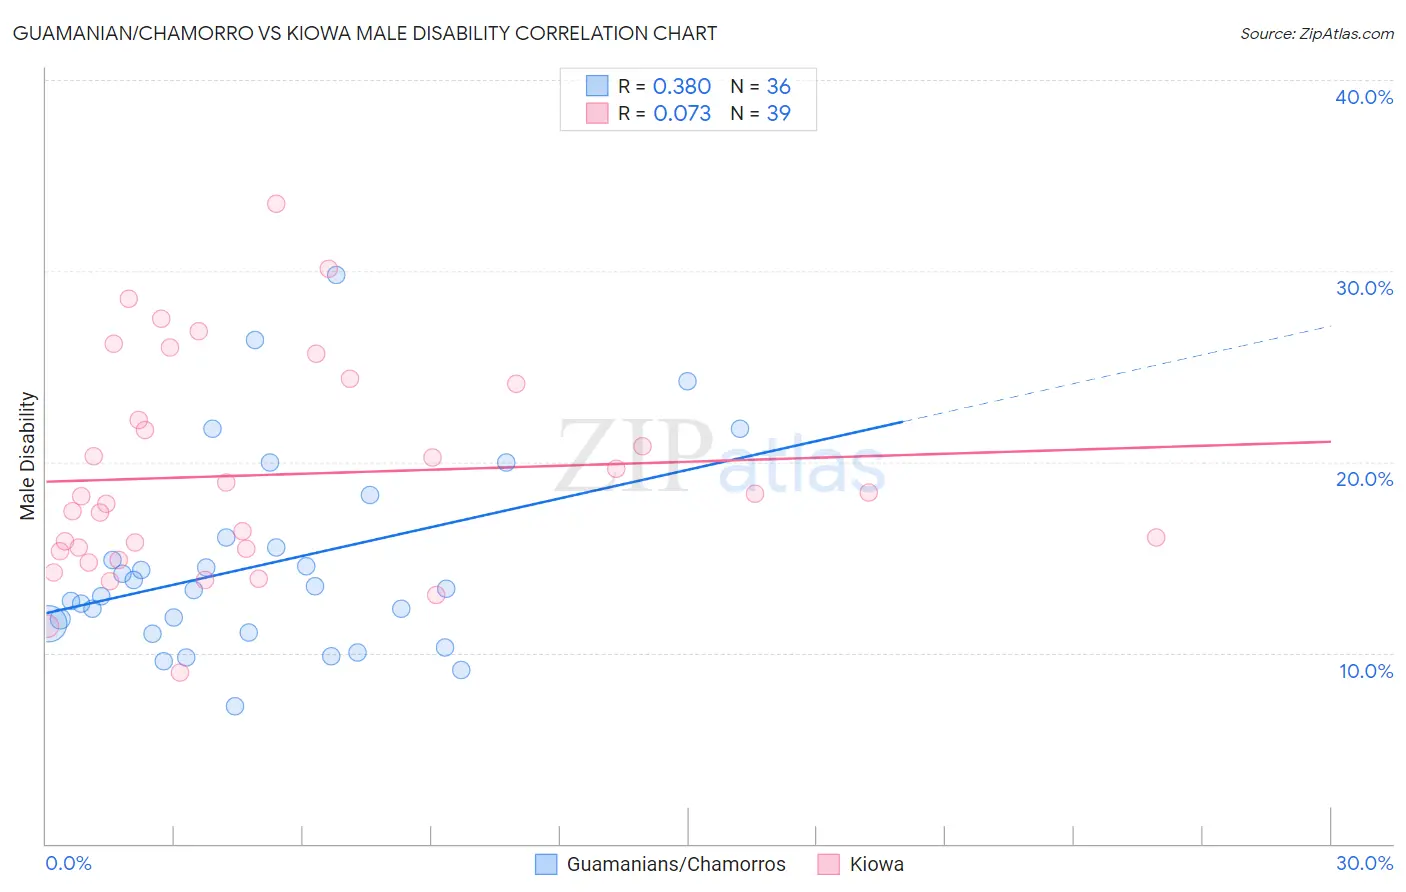
Guamanian/Chamorro vs Kiowa Male Disability Correlation Chart
The statistical analysis conducted on geographies consisting of 221,895,319 people shows a mild positive correlation between the proportion of Guamanians/Chamorros and percentage of males with a disability in the United States with a correlation coefficient (R) of 0.380 and weighted average of 12.0%. Similarly, the statistical analysis conducted on geographies consisting of 56,098,760 people shows a slight positive correlation between the proportion of Kiowa and percentage of males with a disability in the United States with a correlation coefficient (R) of 0.073 and weighted average of 15.4%, a difference of 28.1%.
Male Disability Correlation Summary
| Measurement | Guamanian/Chamorro | Kiowa |
| Minimum | 7.2% | 9.0% |
| Maximum | 29.8% | 33.5% |
| Range | 22.5% | 24.5% |
| Mean | 14.6% | 19.3% |
| Median | 13.3% | 18.2% |
| Interquartile 25% (IQ1) | 11.3% | 15.3% |
| Interquartile 75% (IQ3) | 15.8% | 24.1% |
| Interquartile Range (IQR) | 4.5% | 8.8% |
| Standard Deviation (Sample) | 5.1% | 5.6% |
| Standard Deviation (Population) | 5.0% | 5.5% |
Similar Demographics by Male Disability
Demographics Similar to Guamanians/Chamorros by Male Disability
In terms of male disability, the demographic groups most similar to Guamanians/Chamorros are Slovene (12.0%, a difference of 0.0%), German Russian (12.0%, a difference of 0.070%), Bangladeshi (12.0%, a difference of 0.080%), Immigrants from Yemen (12.0%, a difference of 0.13%), and British (12.1%, a difference of 0.18%).
| Demographics | Rating | Rank | Male Disability |
| Danes | 0.9 /100 | #246 | Tragic 11.9% |
| Hungarians | 0.8 /100 | #247 | Tragic 12.0% |
| Poles | 0.7 /100 | #248 | Tragic 12.0% |
| Immigrants | Yemen | 0.5 /100 | #249 | Tragic 12.0% |
| Bangladeshis | 0.5 /100 | #250 | Tragic 12.0% |
| German Russians | 0.5 /100 | #251 | Tragic 12.0% |
| Slovenes | 0.5 /100 | #252 | Tragic 12.0% |
| Guamanians/Chamorros | 0.5 /100 | #253 | Tragic 12.0% |
| British | 0.4 /100 | #254 | Tragic 12.1% |
| Chinese | 0.4 /100 | #255 | Tragic 12.1% |
| Swiss | 0.3 /100 | #256 | Tragic 12.1% |
| Europeans | 0.3 /100 | #257 | Tragic 12.1% |
| Basques | 0.3 /100 | #258 | Tragic 12.1% |
| Belgians | 0.3 /100 | #259 | Tragic 12.1% |
| Swedes | 0.3 /100 | #260 | Tragic 12.1% |
Demographics Similar to Kiowa by Male Disability
In terms of male disability, the demographic groups most similar to Kiowa are Choctaw (15.4%, a difference of 0.19%), Creek (15.5%, a difference of 0.66%), Puerto Rican (15.6%, a difference of 0.79%), Tsimshian (15.6%, a difference of 1.1%), and Lumbee (15.2%, a difference of 1.3%).
| Demographics | Rating | Rank | Male Disability |
| Yuman | 0.0 /100 | #333 | Tragic 14.7% |
| Cherokee | 0.0 /100 | #334 | Tragic 14.8% |
| Dutch West Indians | 0.0 /100 | #335 | Tragic 14.8% |
| Alaskan Athabascans | 0.0 /100 | #336 | Tragic 14.9% |
| Menominee | 0.0 /100 | #337 | Tragic 15.0% |
| Pueblo | 0.0 /100 | #338 | Tragic 15.0% |
| Chickasaw | 0.0 /100 | #339 | Tragic 15.1% |
| Lumbee | 0.0 /100 | #340 | Tragic 15.2% |
| Choctaw | 0.0 /100 | #341 | Tragic 15.4% |
| Kiowa | 0.0 /100 | #342 | Tragic 15.4% |
| Creek | 0.0 /100 | #343 | Tragic 15.5% |
| Puerto Ricans | 0.0 /100 | #344 | Tragic 15.6% |
| Tsimshian | 0.0 /100 | #345 | Tragic 15.6% |
| Colville | 0.0 /100 | #346 | Tragic 16.5% |
| Houma | 0.0 /100 | #347 | Tragic 17.4% |