Indian (Asian) vs Kiowa Male Disability
COMPARE
Indian (Asian)
Kiowa
Male Disability
Male Disability Comparison
Indians (Asian)
Kiowa
9.7%
MALE DISABILITY
100.0/ 100
METRIC RATING
15th/ 347
METRIC RANK
15.4%
MALE DISABILITY
0.0/ 100
METRIC RATING
342nd/ 347
METRIC RANK
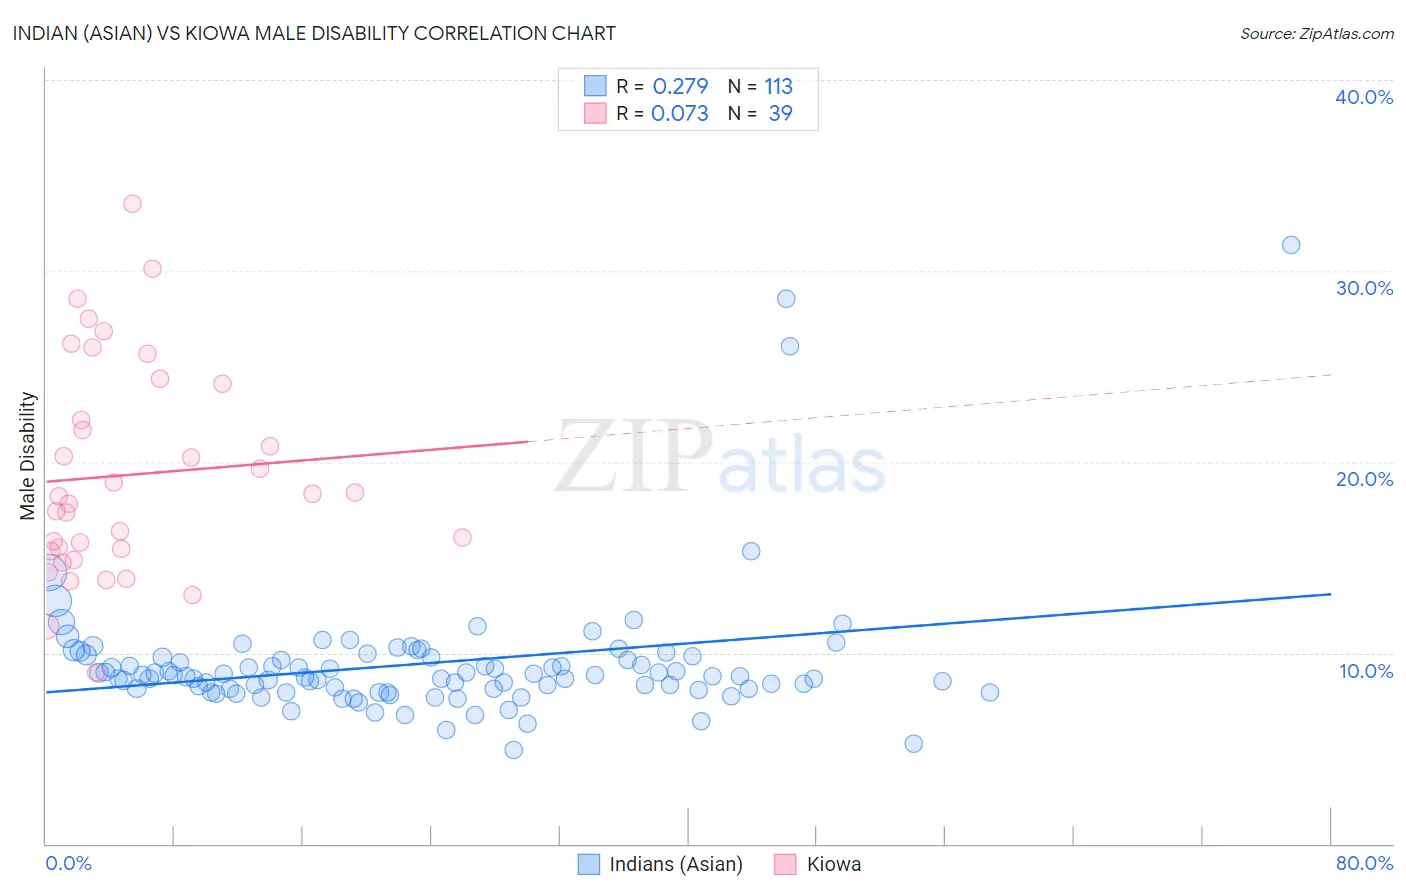
Indian (Asian) vs Kiowa Male Disability Correlation Chart
The statistical analysis conducted on geographies consisting of 495,201,745 people shows a weak positive correlation between the proportion of Indians (Asian) and percentage of males with a disability in the United States with a correlation coefficient (R) of 0.279 and weighted average of 9.7%. Similarly, the statistical analysis conducted on geographies consisting of 56,098,760 people shows a slight positive correlation between the proportion of Kiowa and percentage of males with a disability in the United States with a correlation coefficient (R) of 0.073 and weighted average of 15.4%, a difference of 58.8%.
Male Disability Correlation Summary
| Measurement | Indian (Asian) | Kiowa |
| Minimum | 4.9% | 9.0% |
| Maximum | 31.4% | 33.5% |
| Range | 26.5% | 24.5% |
| Mean | 9.4% | 19.3% |
| Median | 8.8% | 18.2% |
| Interquartile 25% (IQ1) | 8.1% | 15.3% |
| Interquartile 75% (IQ3) | 9.8% | 24.1% |
| Interquartile Range (IQR) | 1.7% | 8.8% |
| Standard Deviation (Sample) | 3.5% | 5.6% |
| Standard Deviation (Population) | 3.5% | 5.5% |
Similar Demographics by Male Disability
Demographics Similar to Indians (Asian) by Male Disability
In terms of male disability, the demographic groups most similar to Indians (Asian) are Immigrants from Iran (9.7%, a difference of 0.45%), Iranian (9.7%, a difference of 0.55%), Okinawan (9.8%, a difference of 0.61%), Immigrants from Korea (9.8%, a difference of 0.75%), and Bolivian (9.6%, a difference of 0.78%).
| Demographics | Rating | Rank | Male Disability |
| Immigrants | China | 100.0 /100 | #8 | Exceptional 9.5% |
| Immigrants | Singapore | 100.0 /100 | #9 | Exceptional 9.5% |
| Immigrants | Israel | 100.0 /100 | #10 | Exceptional 9.6% |
| Immigrants | Eastern Asia | 100.0 /100 | #11 | Exceptional 9.6% |
| Bolivians | 100.0 /100 | #12 | Exceptional 9.6% |
| Iranians | 100.0 /100 | #13 | Exceptional 9.7% |
| Immigrants | Iran | 100.0 /100 | #14 | Exceptional 9.7% |
| Indians (Asian) | 100.0 /100 | #15 | Exceptional 9.7% |
| Okinawans | 100.0 /100 | #16 | Exceptional 9.8% |
| Immigrants | Korea | 100.0 /100 | #17 | Exceptional 9.8% |
| Immigrants | Pakistan | 100.0 /100 | #18 | Exceptional 9.8% |
| Immigrants | Sri Lanka | 100.0 /100 | #19 | Exceptional 10.0% |
| Asians | 100.0 /100 | #20 | Exceptional 10.0% |
| Burmese | 100.0 /100 | #21 | Exceptional 10.0% |
| Immigrants | Venezuela | 100.0 /100 | #22 | Exceptional 10.0% |
Demographics Similar to Kiowa by Male Disability
In terms of male disability, the demographic groups most similar to Kiowa are Choctaw (15.4%, a difference of 0.19%), Creek (15.5%, a difference of 0.66%), Puerto Rican (15.6%, a difference of 0.79%), Tsimshian (15.6%, a difference of 1.1%), and Lumbee (15.2%, a difference of 1.3%).
| Demographics | Rating | Rank | Male Disability |
| Yuman | 0.0 /100 | #333 | Tragic 14.7% |
| Cherokee | 0.0 /100 | #334 | Tragic 14.8% |
| Dutch West Indians | 0.0 /100 | #335 | Tragic 14.8% |
| Alaskan Athabascans | 0.0 /100 | #336 | Tragic 14.9% |
| Menominee | 0.0 /100 | #337 | Tragic 15.0% |
| Pueblo | 0.0 /100 | #338 | Tragic 15.0% |
| Chickasaw | 0.0 /100 | #339 | Tragic 15.1% |
| Lumbee | 0.0 /100 | #340 | Tragic 15.2% |
| Choctaw | 0.0 /100 | #341 | Tragic 15.4% |
| Kiowa | 0.0 /100 | #342 | Tragic 15.4% |
| Creek | 0.0 /100 | #343 | Tragic 15.5% |
| Puerto Ricans | 0.0 /100 | #344 | Tragic 15.6% |
| Tsimshian | 0.0 /100 | #345 | Tragic 15.6% |
| Colville | 0.0 /100 | #346 | Tragic 16.5% |
| Houma | 0.0 /100 | #347 | Tragic 17.4% |