Osage vs Kiowa 1 or more Vehicles in Household
COMPARE
Osage
Kiowa
1 or more Vehicles in Household
1 or more Vehicles in Household Comparison
Osage
Kiowa
91.4%
1 OR MORE VEHICLES IN HOUSEHOLD
99.2/ 100
METRIC RATING
86th/ 347
METRIC RANK
88.6%
1 OR MORE VEHICLES IN HOUSEHOLD
3.8/ 100
METRIC RATING
239th/ 347
METRIC RANK
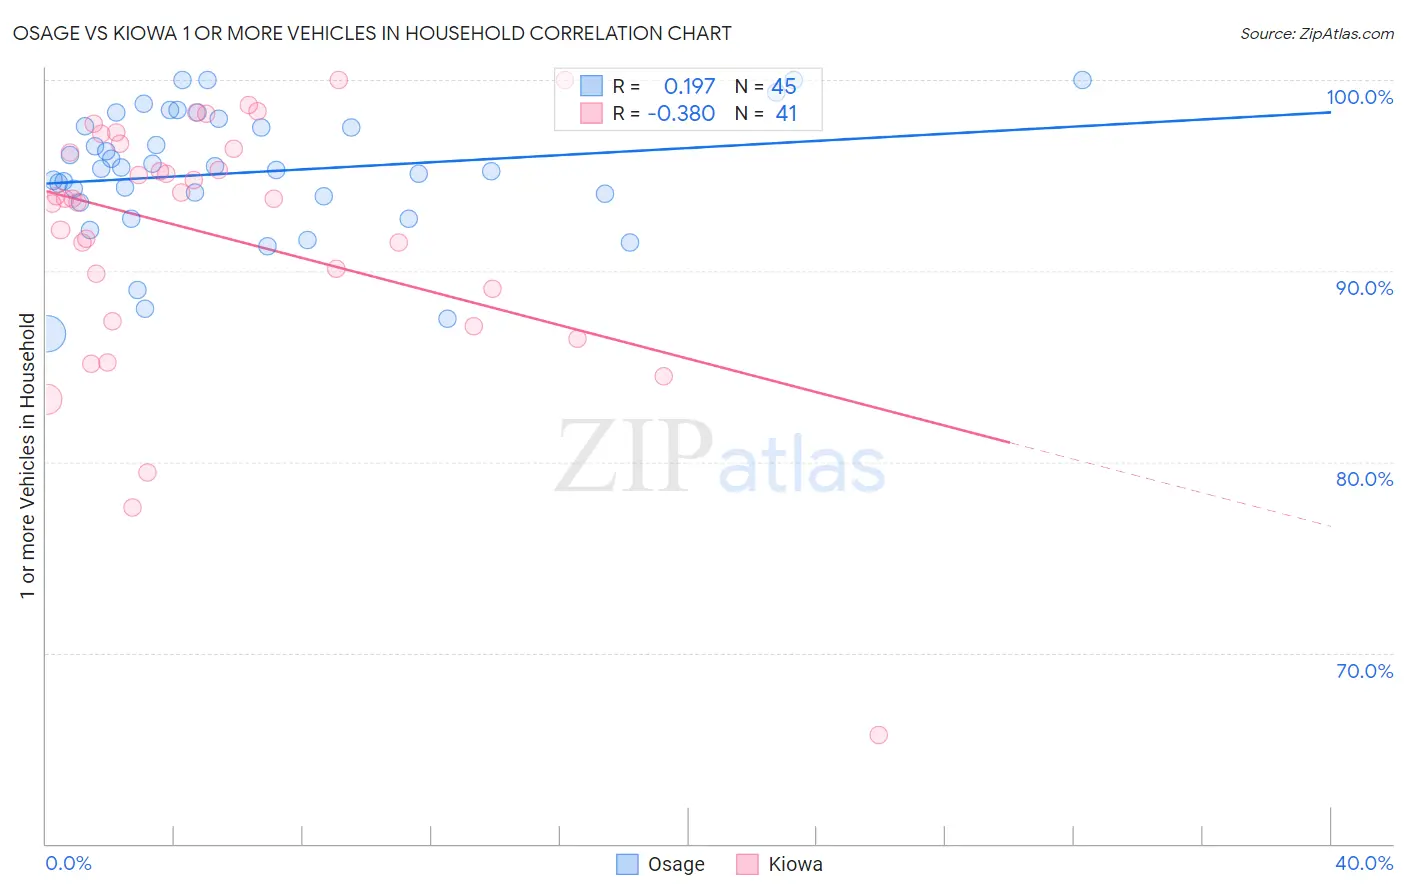
Osage vs Kiowa 1 or more Vehicles in Household Correlation Chart
The statistical analysis conducted on geographies consisting of 91,799,602 people shows a poor positive correlation between the proportion of Osage and percentage of households with 1 or more vehicles available in the United States with a correlation coefficient (R) of 0.197 and weighted average of 91.4%. Similarly, the statistical analysis conducted on geographies consisting of 56,099,396 people shows a mild negative correlation between the proportion of Kiowa and percentage of households with 1 or more vehicles available in the United States with a correlation coefficient (R) of -0.380 and weighted average of 88.6%, a difference of 3.2%.
1 or more Vehicles in Household Correlation Summary
| Measurement | Osage | Kiowa |
| Minimum | 86.7% | 65.7% |
| Maximum | 100.0% | 100.0% |
| Range | 13.3% | 34.3% |
| Mean | 95.2% | 91.8% |
| Median | 95.3% | 93.8% |
| Interquartile 25% (IQ1) | 93.7% | 88.2% |
| Interquartile 75% (IQ3) | 97.8% | 96.6% |
| Interquartile Range (IQR) | 4.1% | 8.4% |
| Standard Deviation (Sample) | 3.3% | 6.9% |
| Standard Deviation (Population) | 3.3% | 6.8% |
Similar Demographics by 1 or more Vehicles in Household
Demographics Similar to Osage by 1 or more Vehicles in Household
In terms of 1 or more vehicles in household, the demographic groups most similar to Osage are Immigrants from Germany (91.4%, a difference of 0.010%), Spanish American (91.4%, a difference of 0.010%), Bangladeshi (91.4%, a difference of 0.010%), Tsimshian (91.4%, a difference of 0.020%), and Immigrants from Canada (91.4%, a difference of 0.020%).
| Demographics | Rating | Rank | 1 or more Vehicles in Household |
| Immigrants | South Central Asia | 99.4 /100 | #79 | Exceptional 91.5% |
| Bolivians | 99.4 /100 | #80 | Exceptional 91.5% |
| Immigrants | South Eastern Asia | 99.3 /100 | #81 | Exceptional 91.4% |
| Lebanese | 99.3 /100 | #82 | Exceptional 91.4% |
| Immigrants | England | 99.3 /100 | #83 | Exceptional 91.4% |
| Jordanians | 99.3 /100 | #84 | Exceptional 91.4% |
| Tsimshian | 99.3 /100 | #85 | Exceptional 91.4% |
| Osage | 99.2 /100 | #86 | Exceptional 91.4% |
| Immigrants | Germany | 99.2 /100 | #87 | Exceptional 91.4% |
| Spanish Americans | 99.2 /100 | #88 | Exceptional 91.4% |
| Bangladeshis | 99.2 /100 | #89 | Exceptional 91.4% |
| Immigrants | Canada | 99.2 /100 | #90 | Exceptional 91.4% |
| Immigrants | Jordan | 99.2 /100 | #91 | Exceptional 91.4% |
| Bhutanese | 99.2 /100 | #92 | Exceptional 91.4% |
| Immigrants | North America | 99.2 /100 | #93 | Exceptional 91.4% |
Demographics Similar to Kiowa by 1 or more Vehicles in Household
In terms of 1 or more vehicles in household, the demographic groups most similar to Kiowa are Immigrants from Somalia (88.6%, a difference of 0.040%), Immigrants from Turkey (88.6%, a difference of 0.060%), Immigrants from Pakistan (88.6%, a difference of 0.070%), Paiute (88.6%, a difference of 0.080%), and Immigrants from Peru (88.6%, a difference of 0.090%).
| Demographics | Rating | Rank | 1 or more Vehicles in Household |
| Immigrants | Japan | 4.9 /100 | #232 | Tragic 88.7% |
| Houma | 4.8 /100 | #233 | Tragic 88.6% |
| Immigrants | Peru | 4.7 /100 | #234 | Tragic 88.6% |
| Paiute | 4.6 /100 | #235 | Tragic 88.6% |
| Immigrants | Pakistan | 4.5 /100 | #236 | Tragic 88.6% |
| Immigrants | Turkey | 4.4 /100 | #237 | Tragic 88.6% |
| Immigrants | Somalia | 4.2 /100 | #238 | Tragic 88.6% |
| Kiowa | 3.8 /100 | #239 | Tragic 88.6% |
| Eastern Europeans | 3.0 /100 | #240 | Tragic 88.5% |
| Taiwanese | 2.6 /100 | #241 | Tragic 88.4% |
| Turks | 2.5 /100 | #242 | Tragic 88.4% |
| Immigrants | Belgium | 2.1 /100 | #243 | Tragic 88.4% |
| Immigrants | Portugal | 2.0 /100 | #244 | Tragic 88.3% |
| Immigrants | Czechoslovakia | 1.9 /100 | #245 | Tragic 88.3% |
| Menominee | 1.9 /100 | #246 | Tragic 88.3% |