Nonimmigrants vs Immigrants from Serbia Disability Age 5 to 17

COMPARE

Nonimmigrants
Race
Ancestry
AfghanAfricanAlaska NativeAlaskan AthabascanAlbanianAleutAlsatianAmericanApacheArabArapahoArgentineanArmenianAssyrian/Chaldean/SyriacAustralianAustrianBahamianBangladeshiBarbadianBasqueBelgianBelizeanBermudanBhutaneseBlackfeetBolivianBrazilianBritishBritish West IndianBulgarianBurmeseCajunCambodianCanadianCape VerdeanCarpatho RusynCelticCentral AmericanCentral American IndianCherokeeCheyenneChickasawChileanChineseChippewaChoctawColombianColvilleComancheCosta RicanCreeCreekCroatianCrowCubanCypriotCzechCzechoslovakianDanishDelawareDominicanDutchDutch West IndianEastern EuropeanEcuadorianEgyptianEnglishEstonianEthiopianEuropeanFijianFilipinoFinnishFrenchFrench American IndianFrench CanadianGermanGerman RussianGhanaianGreekGuamanian/ChamorroGuatemalanGuyaneseHaitianHmongHonduranHopiHoumaHungarianIcelanderIndian (Asian)IndonesianInupiatIranianIraqiIrishIroquoisIsraeliItalianJamaicanJapaneseJordanianKenyanKiowaKoreanLaotianLatvianLebaneseLiberianLithuanianLumbeeLuxembourgerMacedonianMalaysianMalteseMarshalleseMenomineeMexicanMexican American IndianMongolianMoroccanNative HawaiianNavajoNepaleseNew ZealanderNicaraguanNigerianNorthern EuropeanNorwegianOkinawanOsageOttawaPaiutePakistaniPalestinianPanamanianParaguayanPennsylvania GermanPeruvianPimaPolishPortuguesePotawatomiPuebloPuerto RicanPuget Sound SalishRomanianRussianSalvadoranSamoanScandinavianScotch-IrishScottishSeminoleSenegaleseSerbianShoshoneSierra LeoneanSiouxSlavicSlovakSloveneSomaliSouth AfricanSouth AmericanSouth American IndianSoviet UnionSpaniardSpanishSpanish AmericanSpanish American IndianSri LankanSubsaharan AfricanSudaneseSwedishSwissSyrianTaiwaneseThaiTlingit-HaidaTohono O'OdhamTonganTrinidadian and TobagonianTsimshianTurkishU.S. Virgin IslanderUgandanUkrainianUruguayanUteVenezuelanVietnameseWelshWest IndianYakamaYaquiYugoslavianYumanYup'ikZimbabwean
Immigration
NonimmigrantsImmigrantsAfghanistanAfricaAlbaniaArgentinaArmeniaAsiaAustraliaAustriaBahamasBangladeshBarbadosBelarusBelgiumBelizeBoliviaBosnia and HerzegovinaBrazilBulgariaBurma/MyanmarCabo VerdeCambodiaCameroonCanadaCaribbeanCentral AmericaChileChinaColombiaCongoCosta RicaCroatiaCubaCzechoslovakiaDenmarkDominicaDominican RepublicEastern AfricaEastern AsiaEastern EuropeEcuadorEgyptEl SalvadorEnglandEritreaEthiopiaEuropeFijiFranceGermanyGhanaGreeceGrenadaGuatemalaGuyanaHaitiHondurasHong KongHungaryIndiaIndonesiaIranIraqIrelandIsraelItalyJamaicaJapanJordanKazakhstanKenyaKoreaKuwaitLaosLatin AmericaLatviaLebanonLiberiaLithuaniaMalaysiaMexicoMicronesiaMiddle AfricaMoldovaMoroccoNepalNetherlandsNicaraguaNigeriaNorth AmericaNorth MacedoniaNorthern AfricaNorthern EuropeNorwayOceaniaPakistanPanamaPeruPhilippinesPolandPortugalRomaniaRussiaSaudi ArabiaScotlandSenegalSierra LeoneSingaporeSomaliaSouth AfricaSouth AmericaSouth Central AsiaSouth Eastern AsiaSouthern EuropeSpainSri LankaSt. Vincent and the GrenadinesSudanSwedenSwitzerlandSyriaTaiwanThailandTrinidad and TobagoTurkeyUgandaUkraineUruguayUzbekistanVenezuelaVietnamWest IndiesWestern AfricaWestern AsiaWestern EuropeYemenZaireZimbabweAzores
Immigrants from Serbia
Race
Ancestry
AfghanAfricanAlaska NativeAlaskan AthabascanAlbanianAleutAlsatianAmericanApacheArabArapahoArgentineanArmenianAssyrian/Chaldean/SyriacAustralianAustrianBahamianBangladeshiBarbadianBasqueBelgianBelizeanBermudanBhutaneseBlackfeetBolivianBrazilianBritishBritish West IndianBulgarianBurmeseCajunCambodianCanadianCape VerdeanCarpatho RusynCelticCentral AmericanCentral American IndianCherokeeCheyenneChickasawChileanChineseChippewaChoctawColombianColvilleComancheCosta RicanCreeCreekCroatianCrowCubanCypriotCzechCzechoslovakianDanishDelawareDominicanDutchDutch West IndianEastern EuropeanEcuadorianEgyptianEnglishEstonianEthiopianEuropeanFijianFilipinoFinnishFrenchFrench American IndianFrench CanadianGermanGerman RussianGhanaianGreekGuamanian/ChamorroGuatemalanGuyaneseHaitianHmongHonduranHopiHoumaHungarianIcelanderIndian (Asian)IndonesianInupiatIranianIraqiIrishIroquoisIsraeliItalianJamaicanJapaneseJordanianKenyanKiowaKoreanLaotianLatvianLebaneseLiberianLithuanianLumbeeLuxembourgerMacedonianMalaysianMalteseMarshalleseMenomineeMexicanMexican American IndianMongolianMoroccanNative HawaiianNavajoNepaleseNew ZealanderNicaraguanNigerianNorthern EuropeanNorwegianOkinawanOsageOttawaPaiutePakistaniPalestinianPanamanianParaguayanPennsylvania GermanPeruvianPimaPolishPortuguesePotawatomiPuebloPuerto RicanPuget Sound SalishRomanianRussianSalvadoranSamoanScandinavianScotch-IrishScottishSeminoleSenegaleseSerbianShoshoneSierra LeoneanSiouxSlavicSlovakSloveneSomaliSouth AfricanSouth AmericanSouth American IndianSoviet UnionSpaniardSpanishSpanish AmericanSpanish American IndianSri LankanSubsaharan AfricanSudaneseSwedishSwissSyrianTaiwaneseThaiTlingit-HaidaTohono O'OdhamTonganTrinidadian and TobagonianTsimshianTurkishU.S. Virgin IslanderUgandanUkrainianUruguayanUteVenezuelanVietnameseWelshWest IndianYakamaYaquiYugoslavianYumanYup'ikZimbabwean
Immigration
ImmigrantsAfghanistanAfricaAlbaniaArgentinaArmeniaAsiaAustraliaAustriaBahamasBangladeshBarbadosBelarusBelgiumBelizeBoliviaBosnia and HerzegovinaBrazilBulgariaBurma/MyanmarCabo VerdeCambodiaCameroonCanadaCaribbeanCentral AmericaChileChinaColombiaCongoCosta RicaCroatiaCubaCzechoslovakiaDenmarkDominicaDominican RepublicEastern AfricaEastern AsiaEastern EuropeEcuadorEgyptEl SalvadorEnglandEritreaEthiopiaEuropeFijiFranceGermanyGhanaGreeceGrenadaGuatemalaGuyanaHaitiHondurasHong KongHungaryIndiaIndonesiaIranIraqIrelandIsraelItalyJamaicaJapanJordanKazakhstanKenyaKoreaKuwaitLaosLatin AmericaLatviaLebanonLiberiaLithuaniaMalaysiaMexicoMicronesiaMiddle AfricaMoldovaMoroccoNepalNetherlandsNicaraguaNigeriaNorth AmericaNorth MacedoniaNorthern AfricaNorthern EuropeNorwayOceaniaPakistanPanamaPeruPhilippinesPolandPortugalRomaniaRussiaSaudi ArabiaScotlandSenegalSerbiaSierra LeoneSingaporeSomaliaSouth AfricaSouth AmericaSouth Central AsiaSouth Eastern AsiaSouthern EuropeSpainSri LankaSt. Vincent and the GrenadinesSudanSwedenSwitzerlandSyriaTaiwanThailandTrinidad and TobagoTurkeyUgandaUkraineUruguayUzbekistanVenezuelaVietnamWest IndiesWestern AfricaWestern AsiaWestern EuropeYemenZaireZimbabweAzores
Disability Age 5 to 17
Income
Poverty
Unemployment
Labor Participation
Family Structure
Vehicle Availability
Education Level
Disability

Disability Age 5 to 17 Comparison

Nonimmigrants

Immigrants from Serbia

Tragic
Exceptional
6.3%
DISABILITY AGE 5 TO 17
0.0/ 100
METRIC RATING
306th/ 347
METRIC RANK
4.9%
DISABILITY AGE 5 TO 17
100.0/ 100
METRIC RATING
29th/ 347
METRIC RANK

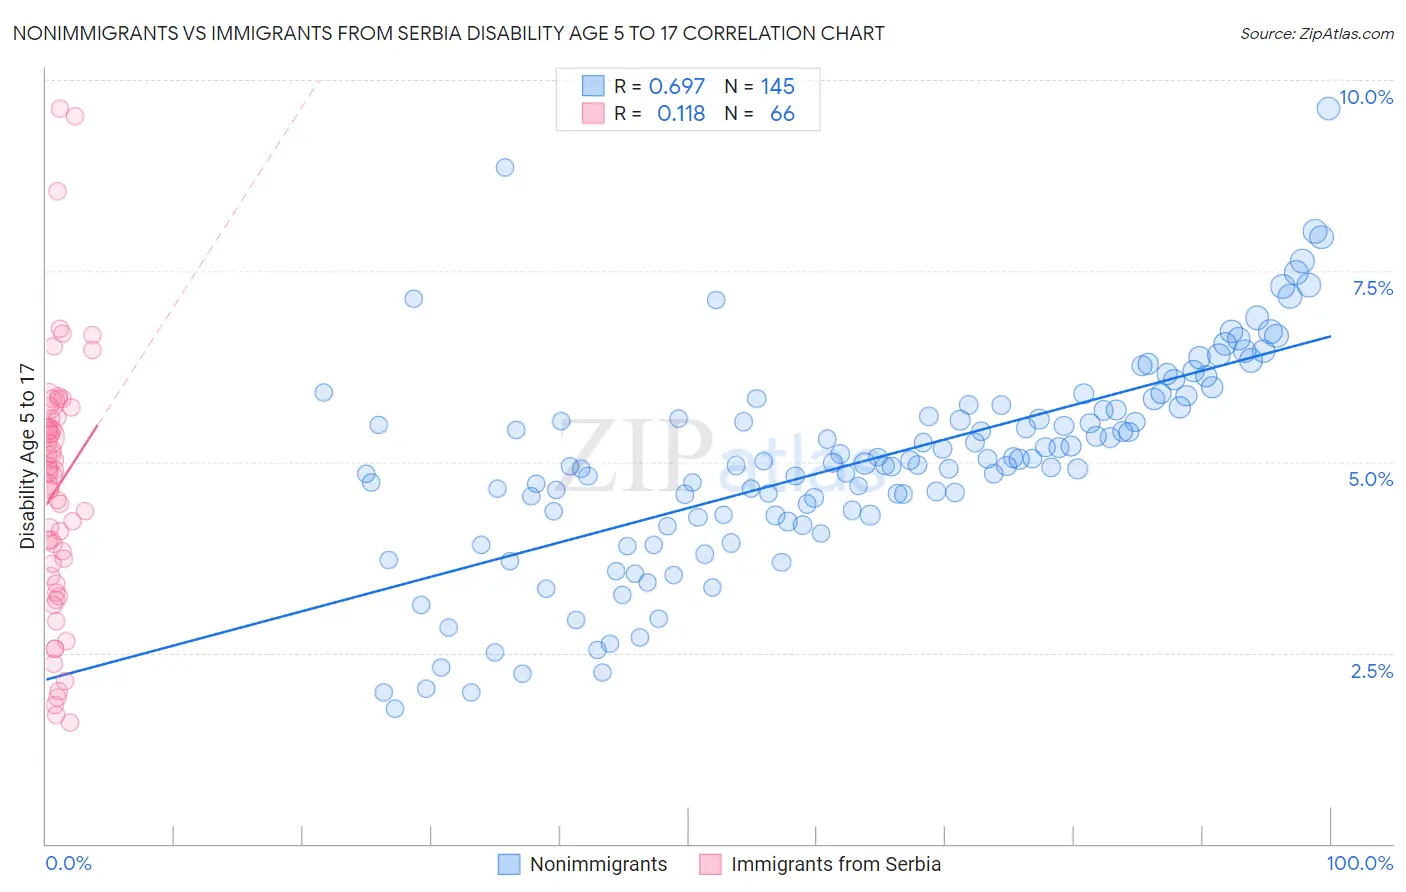
Nonimmigrants vs Immigrants from Serbia Disability Age 5 to 17 Correlation Chart

The statistical analysis conducted on geographies consisting of 567,642,967 people shows a significant positive correlation between the proportion of Nonimmigrants and percentage of population with a disability between the ages 5 and 17 in the United States with a correlation coefficient (R) of 0.697 and weighted average of 6.3%. Similarly, the statistical analysis conducted on geographies consisting of 131,235,247 people shows a poor positive correlation between the proportion of Immigrants from Serbia and percentage of population with a disability between the ages 5 and 17 in the United States with a correlation coefficient (R) of 0.118 and weighted average of 4.9%, a difference of 27.6%.
Nonimmigrants vs Immigrants from Serbia Disability Age 5 to 17

Disability Age 5 to 17 Correlation Summary

MeasurementNonimmigrantsImmigrants from Serbia
Minimum1.8%1.6%
Maximum9.6%9.6%
Range7.9%8.0%
Mean5.0%4.7%
Median5.0%4.9%
Interquartile 25% (IQ1)4.3%3.5%
Interquartile 75% (IQ3)5.7%5.6%
Interquartile Range (IQR)1.4%2.1%
Standard Deviation (Sample)1.4%1.7%
Standard Deviation (Population)1.4%1.7%

Similar Demographics by Disability Age 5 to 17

Demographics Similar to Nonimmigrants by Disability Age 5 to 17

In terms of disability age 5 to 17, the demographic groups most similar to Nonimmigrants are Native/Alaskan (6.3%, a difference of 0.10%), Bahamian (6.3%, a difference of 0.14%), Senegalese (6.3%, a difference of 0.24%), Yakama (6.3%, a difference of 0.32%), and Scotch-Irish (6.3%, a difference of 0.37%).
DemographicsRating | RankDisability Age 5 to 17
Welsh
0.0
/100
|
#299
Tragic
6.3%
Carpatho Rusyns
0.0
/100
|
#300
Tragic
6.3%
U.S. Virgin Islanders
0.0
/100
|
#301
Tragic
6.3%
Celtics
0.0
/100
|
#302
Tragic
6.3%
Yakama
0.0
/100
|
#303
Tragic
6.3%
Senegalese
0.0
/100
|
#304
Tragic
6.3%
Natives/Alaskans
0.0
/100
|
#305
Tragic
6.3%
Immigrants | Nonimmigrants
0.0
/100
|
#306
Tragic
6.3%
Bahamians
0.0
/100
|
#307
Tragic
6.3%
Scotch-Irish
0.0
/100
|
#308
Tragic
6.3%
Hmong
0.0
/100
|
#309
Tragic
6.3%
Alaskan Athabascans
0.0
/100
|
#310
Tragic
6.3%
Immigrants | Dominica
0.0
/100
|
#311
Tragic
6.3%
Bermudans
0.0
/100
|
#312
Tragic
6.4%
Apache
0.0
/100
|
#313
Tragic
6.4%

Demographics Similar to Immigrants from Serbia by Disability Age 5 to 17

In terms of disability age 5 to 17, the demographic groups most similar to Immigrants from Serbia are Immigrants from Malaysia (5.0%, a difference of 0.22%), Immigrants from Pakistan (5.0%, a difference of 0.47%), Immigrants from Japan (4.9%, a difference of 0.48%), Soviet Union (5.0%, a difference of 0.51%), and Taiwanese (4.9%, a difference of 0.56%).
DemographicsRating | RankDisability Age 5 to 17
Asians
100.0
/100
|
#22
Exceptional
4.8%
Immigrants | Bolivia
100.0
/100
|
#23
Exceptional
4.8%
Immigrants | Lebanon
100.0
/100
|
#24
Exceptional
4.8%
Immigrants | Asia
100.0
/100
|
#25
Exceptional
4.8%
Bhutanese
100.0
/100
|
#26
Exceptional
4.9%
Taiwanese
100.0
/100
|
#27
Exceptional
4.9%
Immigrants | Japan
100.0
/100
|
#28
Exceptional
4.9%
Immigrants | Serbia
100.0
/100
|
#29
Exceptional
4.9%
Immigrants | Malaysia
100.0
/100
|
#30
Exceptional
5.0%
Immigrants | Pakistan
100.0
/100
|
#31
Exceptional
5.0%
Soviet Union
100.0
/100
|
#32
Exceptional
5.0%
Immigrants | Indonesia
100.0
/100
|
#33
Exceptional
5.0%
Israelis
100.0
/100
|
#34
Exceptional
5.0%
Bolivians
100.0
/100
|
#35
Exceptional
5.0%
Immigrants | Egypt
100.0
/100
|
#36
Exceptional
5.0%