Nonimmigrants vs Czechoslovakian Disability Age 5 to 17
COMPARE
Nonimmigrants
Czechoslovakian
Disability Age 5 to 17
Disability Age 5 to 17 Comparison
Nonimmigrants
Czechoslovakians
6.3%
DISABILITY AGE 5 TO 17
0.0/ 100
METRIC RATING
306th/ 347
METRIC RANK
5.9%
DISABILITY AGE 5 TO 17
0.7/ 100
METRIC RATING
263rd/ 347
METRIC RANK
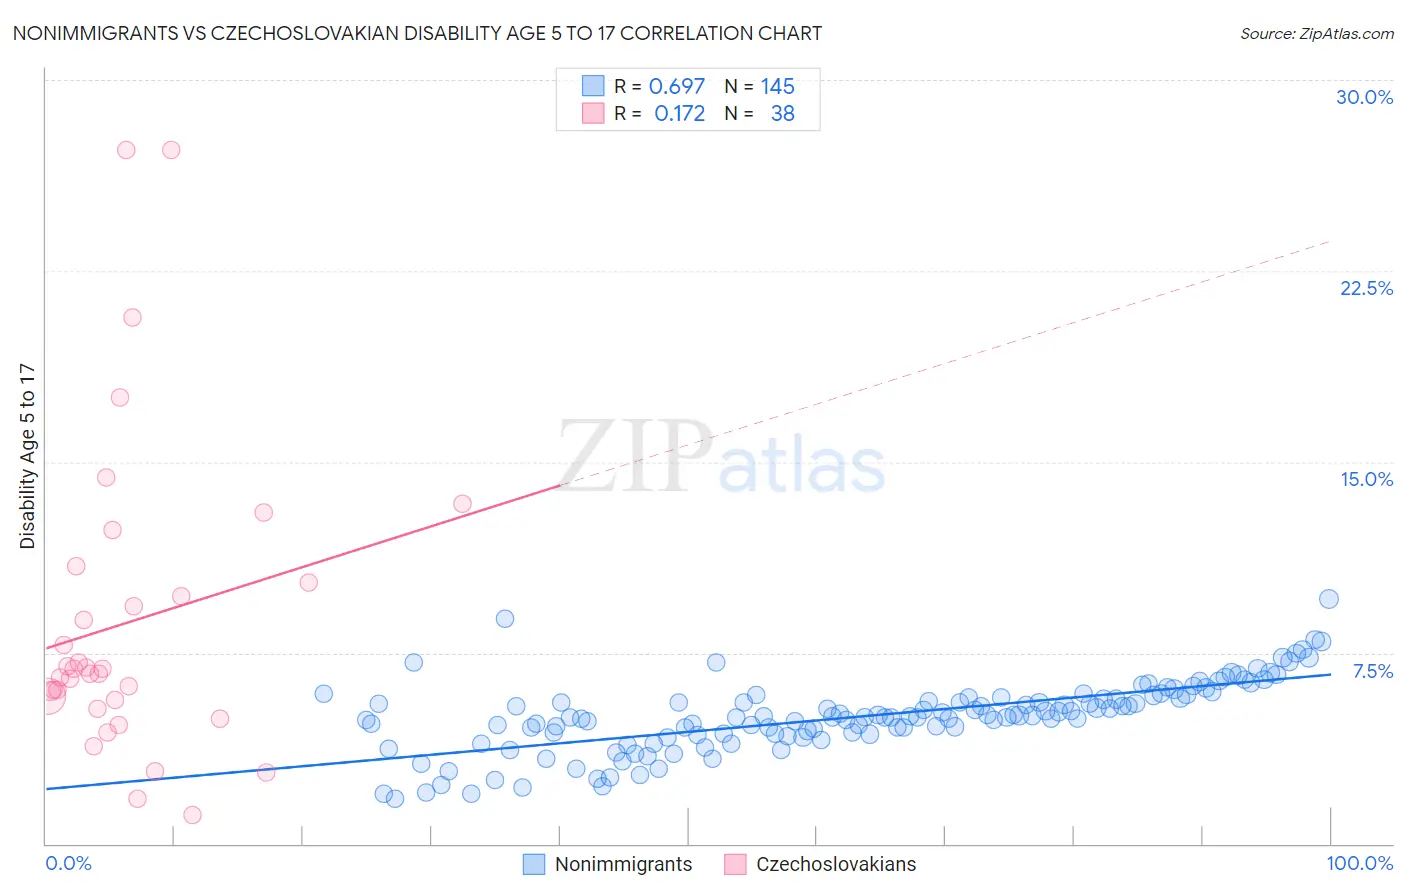
Nonimmigrants vs Czechoslovakian Disability Age 5 to 17 Correlation Chart
The statistical analysis conducted on geographies consisting of 567,642,967 people shows a significant positive correlation between the proportion of Nonimmigrants and percentage of population with a disability between the ages 5 and 17 in the United States with a correlation coefficient (R) of 0.697 and weighted average of 6.3%. Similarly, the statistical analysis conducted on geographies consisting of 365,368,249 people shows a poor positive correlation between the proportion of Czechoslovakians and percentage of population with a disability between the ages 5 and 17 in the United States with a correlation coefficient (R) of 0.172 and weighted average of 5.9%, a difference of 6.2%.
Disability Age 5 to 17 Correlation Summary
| Measurement | Nonimmigrants | Czechoslovakian |
| Minimum | 1.8% | 1.1% |
| Maximum | 9.6% | 27.3% |
| Range | 7.9% | 26.2% |
| Mean | 5.0% | 8.7% |
| Median | 5.0% | 6.8% |
| Interquartile 25% (IQ1) | 4.3% | 5.6% |
| Interquartile 75% (IQ3) | 5.7% | 10.3% |
| Interquartile Range (IQR) | 1.4% | 4.7% |
| Standard Deviation (Sample) | 1.4% | 6.0% |
| Standard Deviation (Population) | 1.4% | 5.9% |
Similar Demographics by Disability Age 5 to 17
Demographics Similar to Nonimmigrants by Disability Age 5 to 17
In terms of disability age 5 to 17, the demographic groups most similar to Nonimmigrants are Native/Alaskan (6.3%, a difference of 0.10%), Bahamian (6.3%, a difference of 0.14%), Senegalese (6.3%, a difference of 0.24%), Yakama (6.3%, a difference of 0.32%), and Scotch-Irish (6.3%, a difference of 0.37%).
| Demographics | Rating | Rank | Disability Age 5 to 17 |
| Welsh | 0.0 /100 | #299 | Tragic 6.3% |
| Carpatho Rusyns | 0.0 /100 | #300 | Tragic 6.3% |
| U.S. Virgin Islanders | 0.0 /100 | #301 | Tragic 6.3% |
| Celtics | 0.0 /100 | #302 | Tragic 6.3% |
| Yakama | 0.0 /100 | #303 | Tragic 6.3% |
| Senegalese | 0.0 /100 | #304 | Tragic 6.3% |
| Natives/Alaskans | 0.0 /100 | #305 | Tragic 6.3% |
| Immigrants | Nonimmigrants | 0.0 /100 | #306 | Tragic 6.3% |
| Bahamians | 0.0 /100 | #307 | Tragic 6.3% |
| Scotch-Irish | 0.0 /100 | #308 | Tragic 6.3% |
| Hmong | 0.0 /100 | #309 | Tragic 6.3% |
| Alaskan Athabascans | 0.0 /100 | #310 | Tragic 6.3% |
| Immigrants | Dominica | 0.0 /100 | #311 | Tragic 6.3% |
| Bermudans | 0.0 /100 | #312 | Tragic 6.4% |
| Apache | 0.0 /100 | #313 | Tragic 6.4% |
Demographics Similar to Czechoslovakians by Disability Age 5 to 17
In terms of disability age 5 to 17, the demographic groups most similar to Czechoslovakians are Immigrants from Western Africa (5.9%, a difference of 0.080%), Immigrants from Middle Africa (5.9%, a difference of 0.11%), Canadian (6.0%, a difference of 0.12%), Somali (5.9%, a difference of 0.18%), and Panamanian (6.0%, a difference of 0.19%).
| Demographics | Rating | Rank | Disability Age 5 to 17 |
| Hopi | 1.0 /100 | #256 | Tragic 5.9% |
| Hispanics or Latinos | 1.0 /100 | #257 | Tragic 5.9% |
| Brazilians | 0.9 /100 | #258 | Tragic 5.9% |
| Slavs | 0.9 /100 | #259 | Tragic 5.9% |
| Somalis | 0.8 /100 | #260 | Tragic 5.9% |
| Immigrants | Middle Africa | 0.7 /100 | #261 | Tragic 5.9% |
| Immigrants | Western Africa | 0.7 /100 | #262 | Tragic 5.9% |
| Czechoslovakians | 0.7 /100 | #263 | Tragic 5.9% |
| Canadians | 0.6 /100 | #264 | Tragic 6.0% |
| Panamanians | 0.6 /100 | #265 | Tragic 6.0% |
| Slovenes | 0.6 /100 | #266 | Tragic 6.0% |
| Spanish | 0.5 /100 | #267 | Tragic 6.0% |
| Sioux | 0.4 /100 | #268 | Tragic 6.0% |
| Liberians | 0.4 /100 | #269 | Tragic 6.0% |
| Immigrants | Somalia | 0.4 /100 | #270 | Tragic 6.0% |