Cheyenne vs Immigrants from Chile Ambulatory Disability
COMPARE
Cheyenne
Immigrants from Chile
Ambulatory Disability
Ambulatory Disability Comparison
Cheyenne
Immigrants from Chile
6.9%
AMBULATORY DISABILITY
0.0/ 100
METRIC RATING
292nd/ 347
METRIC RANK
5.8%
AMBULATORY DISABILITY
98.9/ 100
METRIC RATING
87th/ 347
METRIC RANK
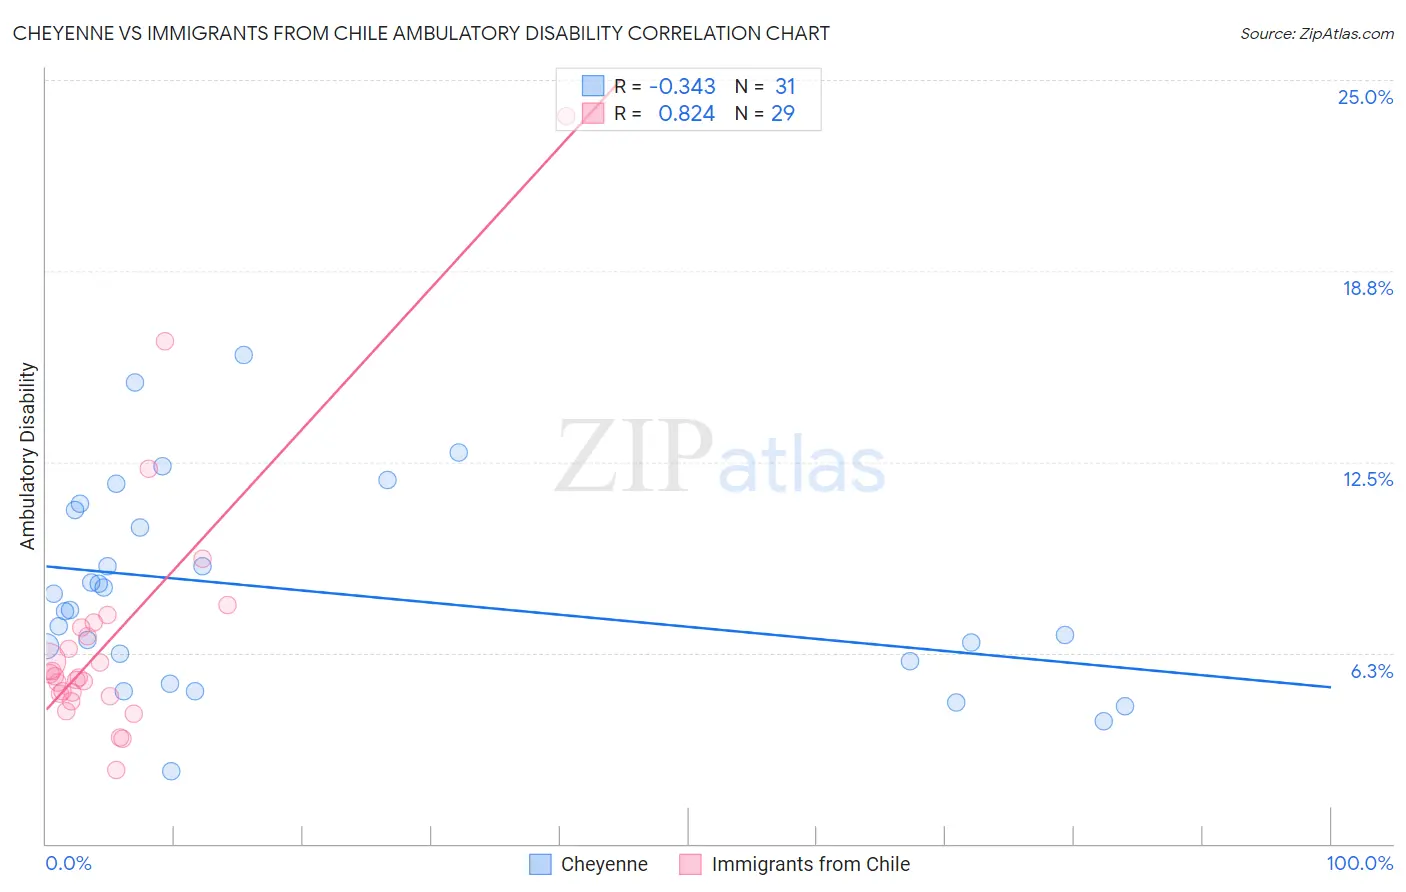
Cheyenne vs Immigrants from Chile Ambulatory Disability Correlation Chart
The statistical analysis conducted on geographies consisting of 80,709,712 people shows a mild negative correlation between the proportion of Cheyenne and percentage of population with ambulatory disability in the United States with a correlation coefficient (R) of -0.343 and weighted average of 6.9%. Similarly, the statistical analysis conducted on geographies consisting of 218,629,833 people shows a very strong positive correlation between the proportion of Immigrants from Chile and percentage of population with ambulatory disability in the United States with a correlation coefficient (R) of 0.824 and weighted average of 5.8%, a difference of 19.5%.
Ambulatory Disability Correlation Summary
| Measurement | Cheyenne | Immigrants from Chile |
| Minimum | 2.4% | 2.4% |
| Maximum | 16.0% | 23.8% |
| Range | 13.6% | 21.4% |
| Mean | 8.3% | 6.8% |
| Median | 7.7% | 5.5% |
| Interquartile 25% (IQ1) | 6.0% | 4.9% |
| Interquartile 75% (IQ3) | 10.9% | 7.2% |
| Interquartile Range (IQR) | 4.9% | 2.3% |
| Standard Deviation (Sample) | 3.3% | 4.3% |
| Standard Deviation (Population) | 3.2% | 4.2% |
Similar Demographics by Ambulatory Disability
Demographics Similar to Cheyenne by Ambulatory Disability
In terms of ambulatory disability, the demographic groups most similar to Cheyenne are West Indian (6.9%, a difference of 0.060%), Scotch-Irish (6.9%, a difference of 0.16%), Immigrants from Dominica (6.9%, a difference of 0.19%), Immigrants from St. Vincent and the Grenadines (6.9%, a difference of 0.24%), and Nonimmigrants (6.9%, a difference of 0.33%).
| Demographics | Rating | Rank | Ambulatory Disability |
| Fijians | 0.0 /100 | #285 | Tragic 6.8% |
| Yakama | 0.0 /100 | #286 | Tragic 6.8% |
| U.S. Virgin Islanders | 0.0 /100 | #287 | Tragic 6.8% |
| Immigrants | Nonimmigrants | 0.0 /100 | #288 | Tragic 6.9% |
| Immigrants | Dominica | 0.0 /100 | #289 | Tragic 6.9% |
| Scotch-Irish | 0.0 /100 | #290 | Tragic 6.9% |
| West Indians | 0.0 /100 | #291 | Tragic 6.9% |
| Cheyenne | 0.0 /100 | #292 | Tragic 6.9% |
| Immigrants | St. Vincent and the Grenadines | 0.0 /100 | #293 | Tragic 6.9% |
| Cape Verdeans | 0.0 /100 | #294 | Tragic 6.9% |
| Crow | 0.0 /100 | #295 | Tragic 6.9% |
| Alaskan Athabascans | 0.0 /100 | #296 | Tragic 6.9% |
| French American Indians | 0.0 /100 | #297 | Tragic 6.9% |
| Immigrants | Grenada | 0.0 /100 | #298 | Tragic 6.9% |
| Puget Sound Salish | 0.0 /100 | #299 | Tragic 6.9% |
Demographics Similar to Immigrants from Chile by Ambulatory Disability
In terms of ambulatory disability, the demographic groups most similar to Immigrants from Chile are Soviet Union (5.8%, a difference of 0.040%), Latvian (5.7%, a difference of 0.060%), South American (5.7%, a difference of 0.090%), Bhutanese (5.8%, a difference of 0.16%), and Australian (5.8%, a difference of 0.16%).
| Demographics | Rating | Rank | Ambulatory Disability |
| Immigrants | Ireland | 99.2 /100 | #80 | Exceptional 5.7% |
| Immigrants | Jordan | 99.2 /100 | #81 | Exceptional 5.7% |
| Palestinians | 99.2 /100 | #82 | Exceptional 5.7% |
| Eastern Europeans | 99.2 /100 | #83 | Exceptional 5.7% |
| Ugandans | 99.2 /100 | #84 | Exceptional 5.7% |
| South Americans | 99.0 /100 | #85 | Exceptional 5.7% |
| Latvians | 99.0 /100 | #86 | Exceptional 5.7% |
| Immigrants | Chile | 98.9 /100 | #87 | Exceptional 5.8% |
| Soviet Union | 98.9 /100 | #88 | Exceptional 5.8% |
| Bhutanese | 98.8 /100 | #89 | Exceptional 5.8% |
| Australians | 98.8 /100 | #90 | Exceptional 5.8% |
| Immigrants | Sudan | 98.8 /100 | #91 | Exceptional 5.8% |
| Immigrants | Sierra Leone | 98.6 /100 | #92 | Exceptional 5.8% |
| Immigrants | Denmark | 98.6 /100 | #93 | Exceptional 5.8% |
| Kenyans | 98.4 /100 | #94 | Exceptional 5.8% |