Immigrants from the Azores vs Immigrants from Chile Ambulatory Disability
COMPARE
Immigrants from the Azores
Immigrants from Chile
Ambulatory Disability
Ambulatory Disability Comparison
Immigrants from the Azores
Immigrants from Chile
7.1%
AMBULATORY DISABILITY
0.0/ 100
METRIC RATING
309th/ 347
METRIC RANK
5.8%
AMBULATORY DISABILITY
98.9/ 100
METRIC RATING
87th/ 347
METRIC RANK
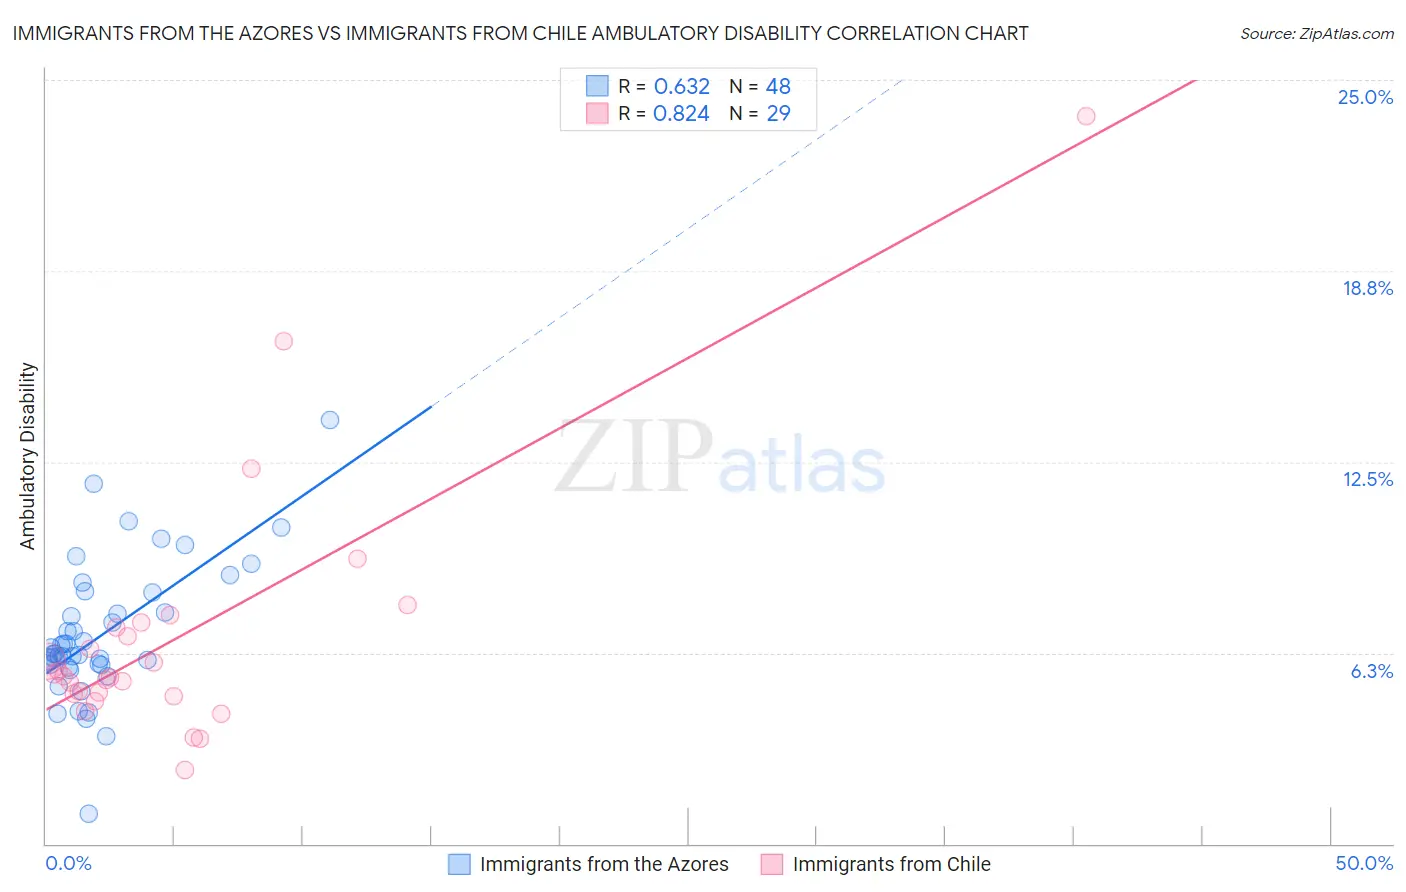
Immigrants from the Azores vs Immigrants from Chile Ambulatory Disability Correlation Chart
The statistical analysis conducted on geographies consisting of 46,257,178 people shows a significant positive correlation between the proportion of Immigrants from the Azores and percentage of population with ambulatory disability in the United States with a correlation coefficient (R) of 0.632 and weighted average of 7.1%. Similarly, the statistical analysis conducted on geographies consisting of 218,629,833 people shows a very strong positive correlation between the proportion of Immigrants from Chile and percentage of population with ambulatory disability in the United States with a correlation coefficient (R) of 0.824 and weighted average of 5.8%, a difference of 23.2%.
Ambulatory Disability Correlation Summary
| Measurement | Immigrants from the Azores | Immigrants from Chile |
| Minimum | 0.99% | 2.4% |
| Maximum | 13.9% | 23.8% |
| Range | 12.9% | 21.4% |
| Mean | 6.8% | 6.8% |
| Median | 6.2% | 5.5% |
| Interquartile 25% (IQ1) | 5.9% | 4.9% |
| Interquartile 75% (IQ3) | 7.9% | 7.2% |
| Interquartile Range (IQR) | 2.0% | 2.3% |
| Standard Deviation (Sample) | 2.2% | 4.3% |
| Standard Deviation (Population) | 2.2% | 4.2% |
Similar Demographics by Ambulatory Disability
Demographics Similar to Immigrants from the Azores by Ambulatory Disability
In terms of ambulatory disability, the demographic groups most similar to Immigrants from the Azores are Spanish American (7.1%, a difference of 0.17%), Chippewa (7.1%, a difference of 0.17%), Arapaho (7.1%, a difference of 0.28%), Cree (7.1%, a difference of 0.29%), and Iroquois (7.1%, a difference of 0.44%).
| Demographics | Rating | Rank | Ambulatory Disability |
| Immigrants | Armenia | 0.0 /100 | #302 | Tragic 7.0% |
| Africans | 0.0 /100 | #303 | Tragic 7.0% |
| Immigrants | Cabo Verde | 0.0 /100 | #304 | Tragic 7.0% |
| Immigrants | Micronesia | 0.0 /100 | #305 | Tragic 7.0% |
| Iroquois | 0.0 /100 | #306 | Tragic 7.1% |
| Spanish Americans | 0.0 /100 | #307 | Tragic 7.1% |
| Chippewa | 0.0 /100 | #308 | Tragic 7.1% |
| Immigrants | Azores | 0.0 /100 | #309 | Tragic 7.1% |
| Arapaho | 0.0 /100 | #310 | Tragic 7.1% |
| Cree | 0.0 /100 | #311 | Tragic 7.1% |
| Delaware | 0.0 /100 | #312 | Tragic 7.1% |
| Immigrants | Yemen | 0.0 /100 | #313 | Tragic 7.1% |
| Blackfeet | 0.0 /100 | #314 | Tragic 7.1% |
| Shoshone | 0.0 /100 | #315 | Tragic 7.1% |
| Immigrants | Dominican Republic | 0.0 /100 | #316 | Tragic 7.1% |
Demographics Similar to Immigrants from Chile by Ambulatory Disability
In terms of ambulatory disability, the demographic groups most similar to Immigrants from Chile are Soviet Union (5.8%, a difference of 0.040%), Latvian (5.7%, a difference of 0.060%), South American (5.7%, a difference of 0.090%), Bhutanese (5.8%, a difference of 0.16%), and Australian (5.8%, a difference of 0.16%).
| Demographics | Rating | Rank | Ambulatory Disability |
| Immigrants | Ireland | 99.2 /100 | #80 | Exceptional 5.7% |
| Immigrants | Jordan | 99.2 /100 | #81 | Exceptional 5.7% |
| Palestinians | 99.2 /100 | #82 | Exceptional 5.7% |
| Eastern Europeans | 99.2 /100 | #83 | Exceptional 5.7% |
| Ugandans | 99.2 /100 | #84 | Exceptional 5.7% |
| South Americans | 99.0 /100 | #85 | Exceptional 5.7% |
| Latvians | 99.0 /100 | #86 | Exceptional 5.7% |
| Immigrants | Chile | 98.9 /100 | #87 | Exceptional 5.8% |
| Soviet Union | 98.9 /100 | #88 | Exceptional 5.8% |
| Bhutanese | 98.8 /100 | #89 | Exceptional 5.8% |
| Australians | 98.8 /100 | #90 | Exceptional 5.8% |
| Immigrants | Sudan | 98.8 /100 | #91 | Exceptional 5.8% |
| Immigrants | Sierra Leone | 98.6 /100 | #92 | Exceptional 5.8% |
| Immigrants | Denmark | 98.6 /100 | #93 | Exceptional 5.8% |
| Kenyans | 98.4 /100 | #94 | Exceptional 5.8% |