Asian vs Immigrants from Chile Ambulatory Disability
COMPARE
Asian
Immigrants from Chile
Ambulatory Disability
Ambulatory Disability Comparison
Asians
Immigrants from Chile
5.4%
AMBULATORY DISABILITY
100.0/ 100
METRIC RATING
27th/ 347
METRIC RANK
5.8%
AMBULATORY DISABILITY
98.9/ 100
METRIC RATING
87th/ 347
METRIC RANK
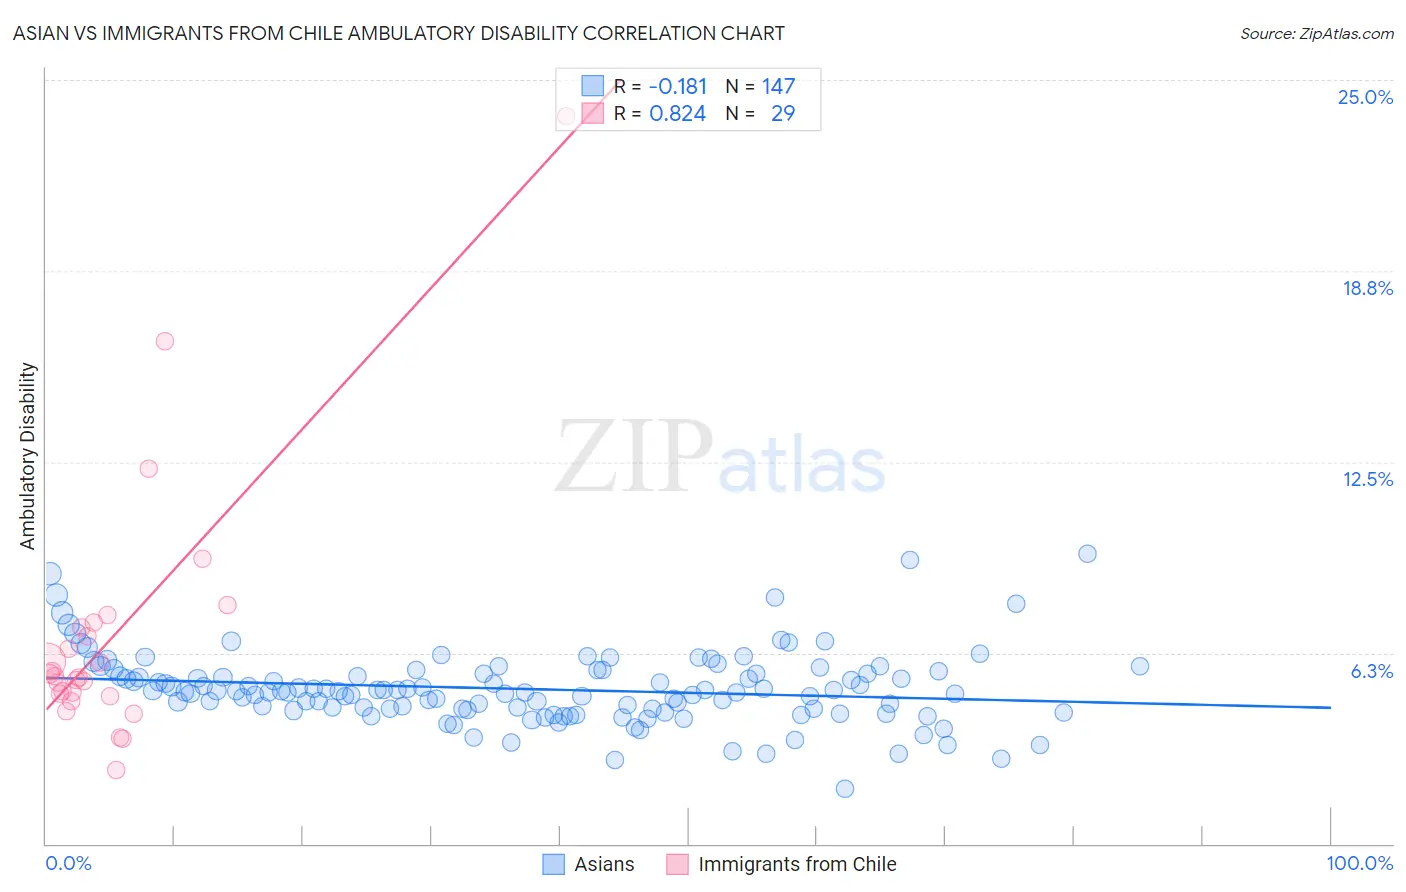
Asian vs Immigrants from Chile Ambulatory Disability Correlation Chart
The statistical analysis conducted on geographies consisting of 550,442,799 people shows a poor negative correlation between the proportion of Asians and percentage of population with ambulatory disability in the United States with a correlation coefficient (R) of -0.181 and weighted average of 5.4%. Similarly, the statistical analysis conducted on geographies consisting of 218,629,833 people shows a very strong positive correlation between the proportion of Immigrants from Chile and percentage of population with ambulatory disability in the United States with a correlation coefficient (R) of 0.824 and weighted average of 5.8%, a difference of 6.4%.
Ambulatory Disability Correlation Summary
| Measurement | Asian | Immigrants from Chile |
| Minimum | 1.8% | 2.4% |
| Maximum | 9.5% | 23.8% |
| Range | 7.7% | 21.4% |
| Mean | 5.1% | 6.8% |
| Median | 5.0% | 5.5% |
| Interquartile 25% (IQ1) | 4.4% | 4.9% |
| Interquartile 75% (IQ3) | 5.6% | 7.2% |
| Interquartile Range (IQR) | 1.2% | 2.3% |
| Standard Deviation (Sample) | 1.2% | 4.3% |
| Standard Deviation (Population) | 1.2% | 4.2% |
Similar Demographics by Ambulatory Disability
Demographics Similar to Asians by Ambulatory Disability
In terms of ambulatory disability, the demographic groups most similar to Asians are Cambodian (5.4%, a difference of 0.060%), Immigrants from Nepal (5.4%, a difference of 0.16%), Immigrants from Iran (5.4%, a difference of 0.16%), Zimbabwean (5.4%, a difference of 0.19%), and Immigrants from Saudi Arabia (5.4%, a difference of 0.27%).
| Demographics | Rating | Rank | Ambulatory Disability |
| Ethiopians | 100.0 /100 | #20 | Exceptional 5.4% |
| Immigrants | Kuwait | 100.0 /100 | #21 | Exceptional 5.4% |
| Immigrants | Israel | 100.0 /100 | #22 | Exceptional 5.4% |
| Tongans | 100.0 /100 | #23 | Exceptional 5.4% |
| Immigrants | Saudi Arabia | 100.0 /100 | #24 | Exceptional 5.4% |
| Zimbabweans | 100.0 /100 | #25 | Exceptional 5.4% |
| Immigrants | Nepal | 100.0 /100 | #26 | Exceptional 5.4% |
| Asians | 100.0 /100 | #27 | Exceptional 5.4% |
| Cambodians | 100.0 /100 | #28 | Exceptional 5.4% |
| Immigrants | Iran | 100.0 /100 | #29 | Exceptional 5.4% |
| Immigrants | Turkey | 100.0 /100 | #30 | Exceptional 5.4% |
| Immigrants | Venezuela | 100.0 /100 | #31 | Exceptional 5.4% |
| Immigrants | Australia | 100.0 /100 | #32 | Exceptional 5.5% |
| Immigrants | Pakistan | 100.0 /100 | #33 | Exceptional 5.5% |
| Immigrants | Asia | 100.0 /100 | #34 | Exceptional 5.5% |
Demographics Similar to Immigrants from Chile by Ambulatory Disability
In terms of ambulatory disability, the demographic groups most similar to Immigrants from Chile are Soviet Union (5.8%, a difference of 0.040%), Latvian (5.7%, a difference of 0.060%), South American (5.7%, a difference of 0.090%), Bhutanese (5.8%, a difference of 0.16%), and Australian (5.8%, a difference of 0.16%).
| Demographics | Rating | Rank | Ambulatory Disability |
| Immigrants | Ireland | 99.2 /100 | #80 | Exceptional 5.7% |
| Immigrants | Jordan | 99.2 /100 | #81 | Exceptional 5.7% |
| Palestinians | 99.2 /100 | #82 | Exceptional 5.7% |
| Eastern Europeans | 99.2 /100 | #83 | Exceptional 5.7% |
| Ugandans | 99.2 /100 | #84 | Exceptional 5.7% |
| South Americans | 99.0 /100 | #85 | Exceptional 5.7% |
| Latvians | 99.0 /100 | #86 | Exceptional 5.7% |
| Immigrants | Chile | 98.9 /100 | #87 | Exceptional 5.8% |
| Soviet Union | 98.9 /100 | #88 | Exceptional 5.8% |
| Bhutanese | 98.8 /100 | #89 | Exceptional 5.8% |
| Australians | 98.8 /100 | #90 | Exceptional 5.8% |
| Immigrants | Sudan | 98.8 /100 | #91 | Exceptional 5.8% |
| Immigrants | Sierra Leone | 98.6 /100 | #92 | Exceptional 5.8% |
| Immigrants | Denmark | 98.6 /100 | #93 | Exceptional 5.8% |
| Kenyans | 98.4 /100 | #94 | Exceptional 5.8% |