Immigrants from Zimbabwe vs Paiute Disability Age 5 to 17
COMPARE
Immigrants from Zimbabwe
Paiute
Disability Age 5 to 17
Disability Age 5 to 17 Comparison
Immigrants from Zimbabwe
Paiute
5.5%
DISABILITY AGE 5 TO 17
75.3/ 100
METRIC RATING
159th/ 347
METRIC RANK
5.7%
DISABILITY AGE 5 TO 17
11.2/ 100
METRIC RATING
204th/ 347
METRIC RANK
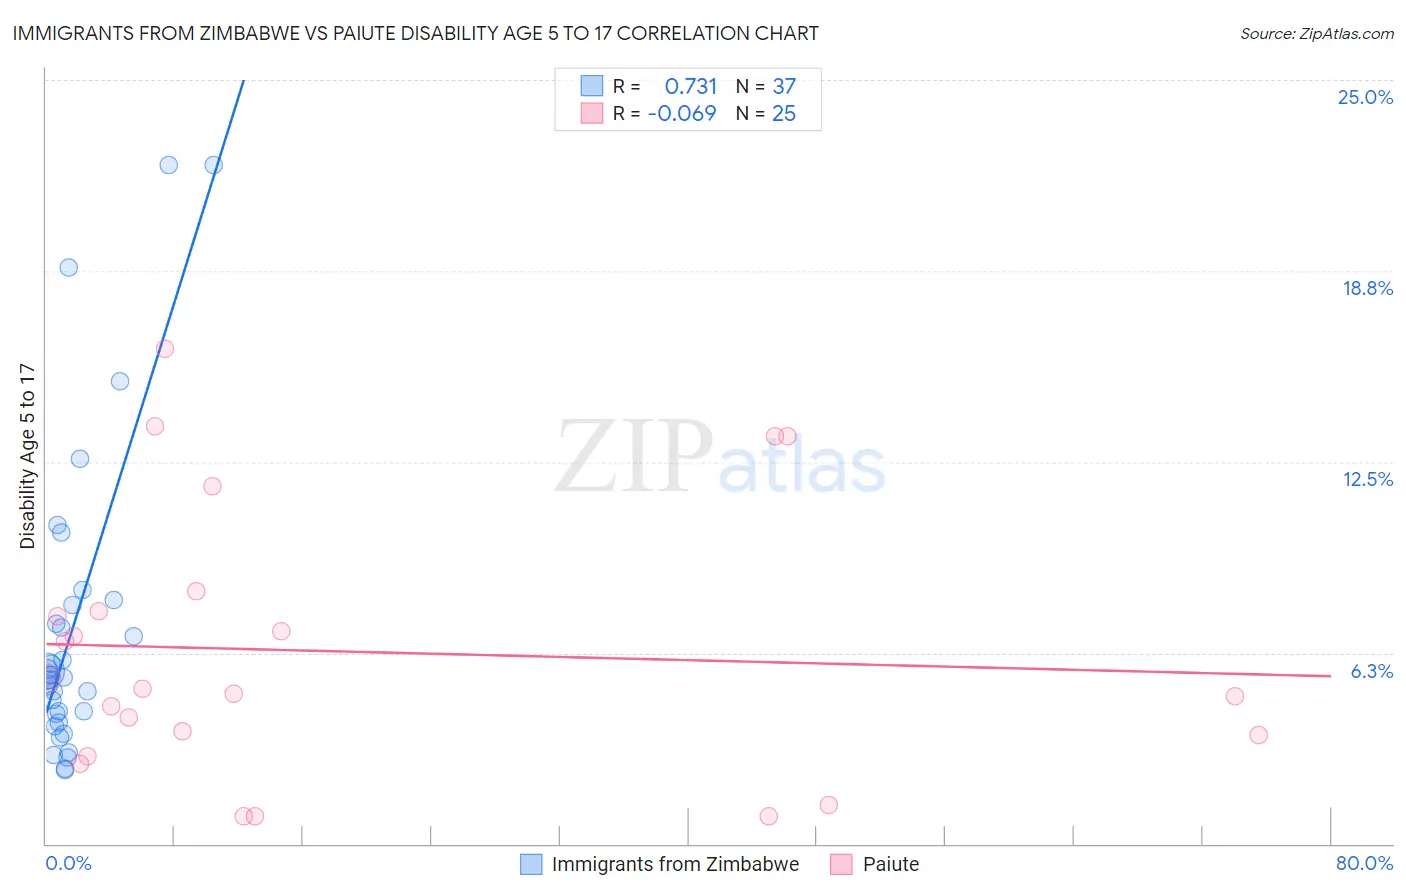
Immigrants from Zimbabwe vs Paiute Disability Age 5 to 17 Correlation Chart
The statistical analysis conducted on geographies consisting of 117,554,818 people shows a strong positive correlation between the proportion of Immigrants from Zimbabwe and percentage of population with a disability between the ages 5 and 17 in the United States with a correlation coefficient (R) of 0.731 and weighted average of 5.5%. Similarly, the statistical analysis conducted on geographies consisting of 58,225,397 people shows a slight negative correlation between the proportion of Paiute and percentage of population with a disability between the ages 5 and 17 in the United States with a correlation coefficient (R) of -0.069 and weighted average of 5.7%, a difference of 4.0%.
Disability Age 5 to 17 Correlation Summary
| Measurement | Immigrants from Zimbabwe | Paiute |
| Minimum | 2.4% | 0.89% |
| Maximum | 22.2% | 16.2% |
| Range | 19.8% | 15.3% |
| Mean | 7.1% | 6.3% |
| Median | 5.5% | 5.1% |
| Interquartile 25% (IQ1) | 4.1% | 3.2% |
| Interquartile 75% (IQ3) | 7.9% | 7.9% |
| Interquartile Range (IQR) | 3.8% | 4.7% |
| Standard Deviation (Sample) | 5.0% | 4.4% |
| Standard Deviation (Population) | 5.0% | 4.3% |
Similar Demographics by Disability Age 5 to 17
Demographics Similar to Immigrants from Zimbabwe by Disability Age 5 to 17
In terms of disability age 5 to 17, the demographic groups most similar to Immigrants from Zimbabwe are Immigrants from Nepal (5.5%, a difference of 0.13%), South African (5.5%, a difference of 0.13%), Immigrants from Costa Rica (5.5%, a difference of 0.18%), Hawaiian (5.5%, a difference of 0.19%), and Immigrants from Ecuador (5.5%, a difference of 0.21%).
| Demographics | Rating | Rank | Disability Age 5 to 17 |
| Ute | 80.6 /100 | #152 | Excellent 5.5% |
| Ecuadorians | 79.7 /100 | #153 | Good 5.5% |
| Australians | 78.8 /100 | #154 | Good 5.5% |
| Immigrants | Ecuador | 78.3 /100 | #155 | Good 5.5% |
| Hawaiians | 78.0 /100 | #156 | Good 5.5% |
| Immigrants | Costa Rica | 77.9 /100 | #157 | Good 5.5% |
| Immigrants | Nepal | 77.1 /100 | #158 | Good 5.5% |
| Immigrants | Zimbabwe | 75.3 /100 | #159 | Good 5.5% |
| South Africans | 73.3 /100 | #160 | Good 5.5% |
| Immigrants | Saudi Arabia | 69.1 /100 | #161 | Good 5.5% |
| Zimbabweans | 67.2 /100 | #162 | Good 5.5% |
| Immigrants | Southern Europe | 64.0 /100 | #163 | Good 5.6% |
| Immigrants | Scotland | 61.9 /100 | #164 | Good 5.6% |
| Lebanese | 61.4 /100 | #165 | Good 5.6% |
| Greeks | 60.6 /100 | #166 | Good 5.6% |
Demographics Similar to Paiute by Disability Age 5 to 17
In terms of disability age 5 to 17, the demographic groups most similar to Paiute are Trinidadian and Tobagonian (5.7%, a difference of 0.050%), Immigrants from Africa (5.7%, a difference of 0.060%), Moroccan (5.7%, a difference of 0.10%), Kenyan (5.8%, a difference of 0.15%), and Spanish American Indian (5.7%, a difference of 0.18%).
| Demographics | Rating | Rank | Disability Age 5 to 17 |
| Immigrants | North America | 23.1 /100 | #197 | Fair 5.7% |
| Norwegians | 20.9 /100 | #198 | Fair 5.7% |
| Northern Europeans | 15.2 /100 | #199 | Poor 5.7% |
| Icelanders | 14.6 /100 | #200 | Poor 5.7% |
| Basques | 13.7 /100 | #201 | Poor 5.7% |
| Austrians | 13.2 /100 | #202 | Poor 5.7% |
| Spanish American Indians | 12.8 /100 | #203 | Poor 5.7% |
| Paiute | 11.2 /100 | #204 | Poor 5.7% |
| Trinidadians and Tobagonians | 10.8 /100 | #205 | Poor 5.7% |
| Immigrants | Africa | 10.8 /100 | #206 | Poor 5.7% |
| Moroccans | 10.4 /100 | #207 | Poor 5.7% |
| Kenyans | 10.0 /100 | #208 | Poor 5.8% |
| Immigrants | Uganda | 9.7 /100 | #209 | Tragic 5.8% |
| Immigrants | Haiti | 9.5 /100 | #210 | Tragic 5.8% |
| Yugoslavians | 9.1 /100 | #211 | Tragic 5.8% |