Immigrants from Zimbabwe vs Nonimmigrants Disability Age 5 to 17
COMPARE
Immigrants from Zimbabwe
Nonimmigrants
Disability Age 5 to 17
Disability Age 5 to 17 Comparison
Immigrants from Zimbabwe
Nonimmigrants
5.5%
DISABILITY AGE 5 TO 17
75.3/ 100
METRIC RATING
159th/ 347
METRIC RANK
6.3%
DISABILITY AGE 5 TO 17
0.0/ 100
METRIC RATING
306th/ 347
METRIC RANK
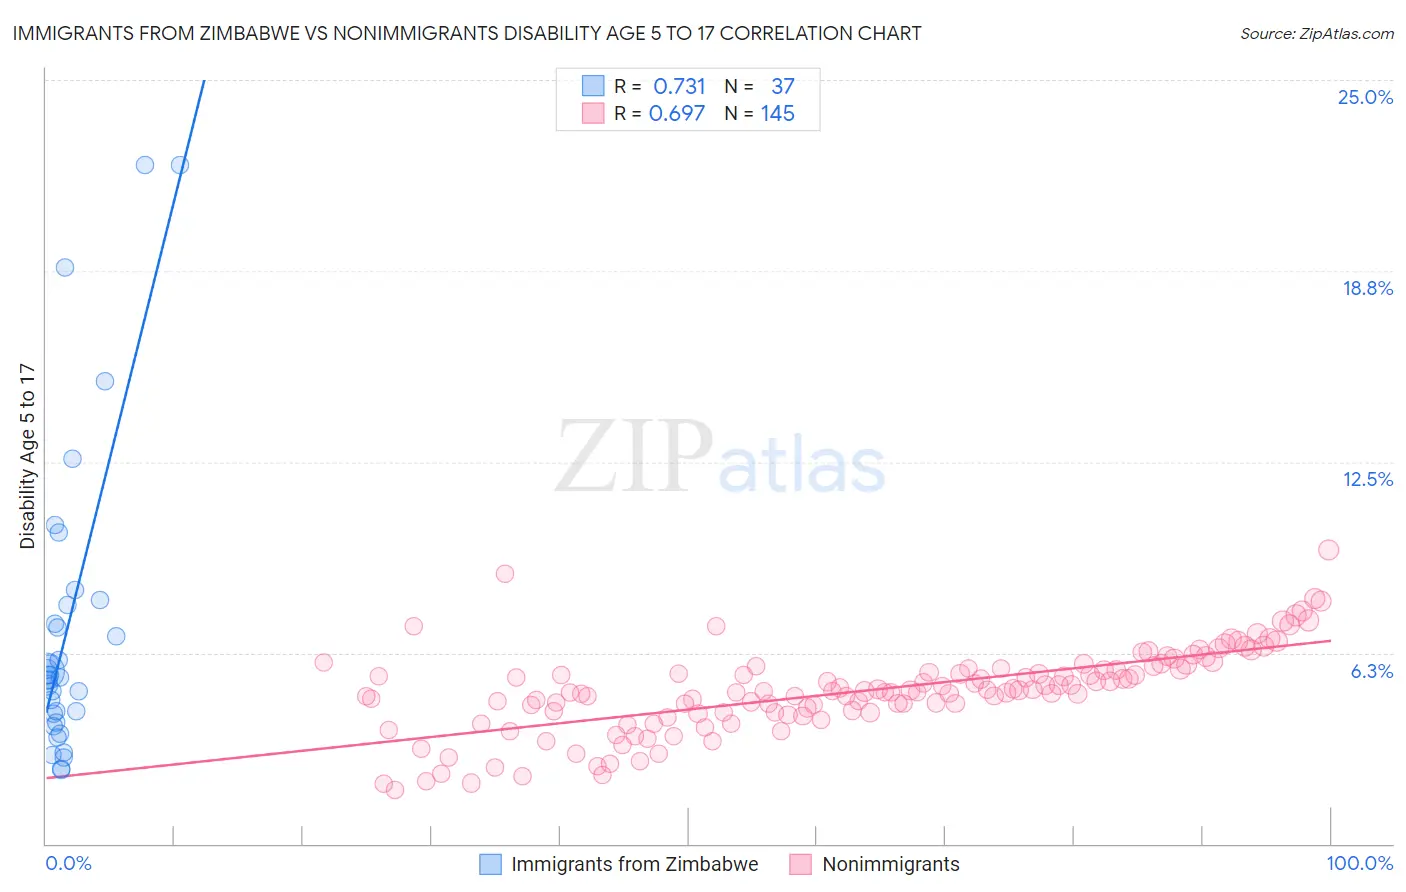
Immigrants from Zimbabwe vs Nonimmigrants Disability Age 5 to 17 Correlation Chart
The statistical analysis conducted on geographies consisting of 117,554,818 people shows a strong positive correlation between the proportion of Immigrants from Zimbabwe and percentage of population with a disability between the ages 5 and 17 in the United States with a correlation coefficient (R) of 0.731 and weighted average of 5.5%. Similarly, the statistical analysis conducted on geographies consisting of 567,642,967 people shows a significant positive correlation between the proportion of Nonimmigrants and percentage of population with a disability between the ages 5 and 17 in the United States with a correlation coefficient (R) of 0.697 and weighted average of 6.3%, a difference of 14.3%.
Disability Age 5 to 17 Correlation Summary
| Measurement | Immigrants from Zimbabwe | Nonimmigrants |
| Minimum | 2.4% | 1.8% |
| Maximum | 22.2% | 9.6% |
| Range | 19.8% | 7.9% |
| Mean | 7.1% | 5.0% |
| Median | 5.5% | 5.0% |
| Interquartile 25% (IQ1) | 4.1% | 4.3% |
| Interquartile 75% (IQ3) | 7.9% | 5.7% |
| Interquartile Range (IQR) | 3.8% | 1.4% |
| Standard Deviation (Sample) | 5.0% | 1.4% |
| Standard Deviation (Population) | 5.0% | 1.4% |
Similar Demographics by Disability Age 5 to 17
Demographics Similar to Immigrants from Zimbabwe by Disability Age 5 to 17
In terms of disability age 5 to 17, the demographic groups most similar to Immigrants from Zimbabwe are Immigrants from Nepal (5.5%, a difference of 0.13%), South African (5.5%, a difference of 0.13%), Immigrants from Costa Rica (5.5%, a difference of 0.18%), Hawaiian (5.5%, a difference of 0.19%), and Immigrants from Ecuador (5.5%, a difference of 0.21%).
| Demographics | Rating | Rank | Disability Age 5 to 17 |
| Ute | 80.6 /100 | #152 | Excellent 5.5% |
| Ecuadorians | 79.7 /100 | #153 | Good 5.5% |
| Australians | 78.8 /100 | #154 | Good 5.5% |
| Immigrants | Ecuador | 78.3 /100 | #155 | Good 5.5% |
| Hawaiians | 78.0 /100 | #156 | Good 5.5% |
| Immigrants | Costa Rica | 77.9 /100 | #157 | Good 5.5% |
| Immigrants | Nepal | 77.1 /100 | #158 | Good 5.5% |
| Immigrants | Zimbabwe | 75.3 /100 | #159 | Good 5.5% |
| South Africans | 73.3 /100 | #160 | Good 5.5% |
| Immigrants | Saudi Arabia | 69.1 /100 | #161 | Good 5.5% |
| Zimbabweans | 67.2 /100 | #162 | Good 5.5% |
| Immigrants | Southern Europe | 64.0 /100 | #163 | Good 5.6% |
| Immigrants | Scotland | 61.9 /100 | #164 | Good 5.6% |
| Lebanese | 61.4 /100 | #165 | Good 5.6% |
| Greeks | 60.6 /100 | #166 | Good 5.6% |
Demographics Similar to Nonimmigrants by Disability Age 5 to 17
In terms of disability age 5 to 17, the demographic groups most similar to Nonimmigrants are Native/Alaskan (6.3%, a difference of 0.10%), Bahamian (6.3%, a difference of 0.14%), Senegalese (6.3%, a difference of 0.24%), Yakama (6.3%, a difference of 0.32%), and Scotch-Irish (6.3%, a difference of 0.37%).
| Demographics | Rating | Rank | Disability Age 5 to 17 |
| Welsh | 0.0 /100 | #299 | Tragic 6.3% |
| Carpatho Rusyns | 0.0 /100 | #300 | Tragic 6.3% |
| U.S. Virgin Islanders | 0.0 /100 | #301 | Tragic 6.3% |
| Celtics | 0.0 /100 | #302 | Tragic 6.3% |
| Yakama | 0.0 /100 | #303 | Tragic 6.3% |
| Senegalese | 0.0 /100 | #304 | Tragic 6.3% |
| Natives/Alaskans | 0.0 /100 | #305 | Tragic 6.3% |
| Immigrants | Nonimmigrants | 0.0 /100 | #306 | Tragic 6.3% |
| Bahamians | 0.0 /100 | #307 | Tragic 6.3% |
| Scotch-Irish | 0.0 /100 | #308 | Tragic 6.3% |
| Hmong | 0.0 /100 | #309 | Tragic 6.3% |
| Alaskan Athabascans | 0.0 /100 | #310 | Tragic 6.3% |
| Immigrants | Dominica | 0.0 /100 | #311 | Tragic 6.3% |
| Bermudans | 0.0 /100 | #312 | Tragic 6.4% |
| Apache | 0.0 /100 | #313 | Tragic 6.4% |