Immigrants from West Indies vs Italian Disability Age 5 to 17
COMPARE
Immigrants from West Indies
Italian
Disability Age 5 to 17
Disability Age 5 to 17 Comparison
Immigrants from West Indies
Italians
5.8%
DISABILITY AGE 5 TO 17
3.5/ 100
METRIC RATING
233rd/ 347
METRIC RANK
5.9%
DISABILITY AGE 5 TO 17
1.2/ 100
METRIC RATING
255th/ 347
METRIC RANK
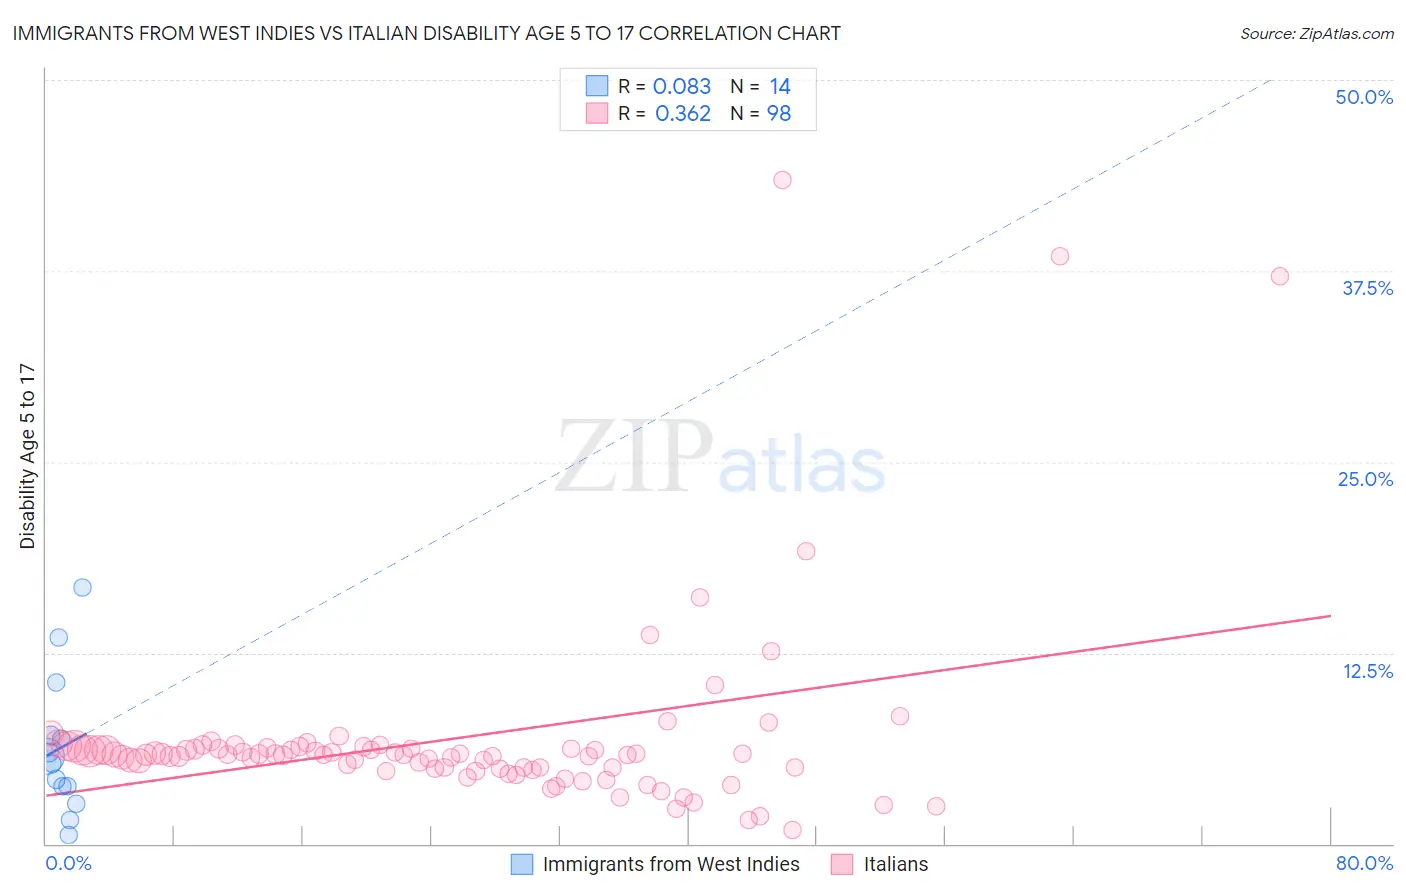
Immigrants from West Indies vs Italian Disability Age 5 to 17 Correlation Chart
The statistical analysis conducted on geographies consisting of 72,374,754 people shows a slight positive correlation between the proportion of Immigrants from West Indies and percentage of population with a disability between the ages 5 and 17 in the United States with a correlation coefficient (R) of 0.083 and weighted average of 5.8%. Similarly, the statistical analysis conducted on geographies consisting of 560,593,784 people shows a mild positive correlation between the proportion of Italians and percentage of population with a disability between the ages 5 and 17 in the United States with a correlation coefficient (R) of 0.362 and weighted average of 5.9%, a difference of 1.3%.
Disability Age 5 to 17 Correlation Summary
| Measurement | Immigrants from West Indies | Italian |
| Minimum | 0.57% | 0.89% |
| Maximum | 16.8% | 43.5% |
| Range | 16.2% | 42.6% |
| Mean | 6.3% | 6.9% |
| Median | 5.5% | 5.8% |
| Interquartile 25% (IQ1) | 3.8% | 4.9% |
| Interquartile 75% (IQ3) | 7.1% | 6.2% |
| Interquartile Range (IQR) | 3.3% | 1.3% |
| Standard Deviation (Sample) | 4.5% | 6.4% |
| Standard Deviation (Population) | 4.4% | 6.4% |
Similar Demographics by Disability Age 5 to 17
Demographics Similar to Immigrants from West Indies by Disability Age 5 to 17
In terms of disability age 5 to 17, the demographic groups most similar to Immigrants from West Indies are Immigrants from Kenya (5.8%, a difference of 0.040%), Malaysian (5.8%, a difference of 0.050%), Immigrants from Laos (5.8%, a difference of 0.090%), Immigrants from Brazil (5.8%, a difference of 0.11%), and Sudanese (5.8%, a difference of 0.26%).
| Demographics | Rating | Rank | Disability Age 5 to 17 |
| British West Indians | 5.4 /100 | #226 | Tragic 5.8% |
| Swiss | 5.1 /100 | #227 | Tragic 5.8% |
| Haitians | 4.8 /100 | #228 | Tragic 5.8% |
| Bangladeshis | 4.8 /100 | #229 | Tragic 5.8% |
| Ghanaians | 4.7 /100 | #230 | Tragic 5.8% |
| Europeans | 4.5 /100 | #231 | Tragic 5.8% |
| Immigrants | Laos | 3.8 /100 | #232 | Tragic 5.8% |
| Immigrants | West Indies | 3.5 /100 | #233 | Tragic 5.8% |
| Immigrants | Kenya | 3.4 /100 | #234 | Tragic 5.8% |
| Malaysians | 3.4 /100 | #235 | Tragic 5.8% |
| Immigrants | Brazil | 3.2 /100 | #236 | Tragic 5.8% |
| Sudanese | 2.9 /100 | #237 | Tragic 5.8% |
| Hungarians | 2.6 /100 | #238 | Tragic 5.8% |
| German Russians | 2.4 /100 | #239 | Tragic 5.9% |
| West Indians | 2.4 /100 | #240 | Tragic 5.9% |
Demographics Similar to Italians by Disability Age 5 to 17
In terms of disability age 5 to 17, the demographic groups most similar to Italians are Barbadian (5.9%, a difference of 0.070%), Scandinavian (5.9%, a difference of 0.17%), Hopi (5.9%, a difference of 0.20%), Honduran (5.9%, a difference of 0.24%), and Immigrants from Cambodia (5.9%, a difference of 0.26%).
| Demographics | Rating | Rank | Disability Age 5 to 17 |
| British | 1.7 /100 | #248 | Tragic 5.9% |
| Immigrants | Ghana | 1.7 /100 | #249 | Tragic 5.9% |
| Poles | 1.5 /100 | #250 | Tragic 5.9% |
| Immigrants | Cambodia | 1.5 /100 | #251 | Tragic 5.9% |
| Hondurans | 1.5 /100 | #252 | Tragic 5.9% |
| Scandinavians | 1.4 /100 | #253 | Tragic 5.9% |
| Barbadians | 1.3 /100 | #254 | Tragic 5.9% |
| Italians | 1.2 /100 | #255 | Tragic 5.9% |
| Hopi | 1.0 /100 | #256 | Tragic 5.9% |
| Hispanics or Latinos | 1.0 /100 | #257 | Tragic 5.9% |
| Brazilians | 0.9 /100 | #258 | Tragic 5.9% |
| Slavs | 0.9 /100 | #259 | Tragic 5.9% |
| Somalis | 0.8 /100 | #260 | Tragic 5.9% |
| Immigrants | Middle Africa | 0.7 /100 | #261 | Tragic 5.9% |
| Immigrants | Western Africa | 0.7 /100 | #262 | Tragic 5.9% |