British vs Italian Disability Age 5 to 17
COMPARE
British
Italian
Disability Age 5 to 17
Disability Age 5 to 17 Comparison
British
Italians
5.9%
DISABILITY AGE 5 TO 17
1.7/ 100
METRIC RATING
248th/ 347
METRIC RANK
5.9%
DISABILITY AGE 5 TO 17
1.2/ 100
METRIC RATING
255th/ 347
METRIC RANK
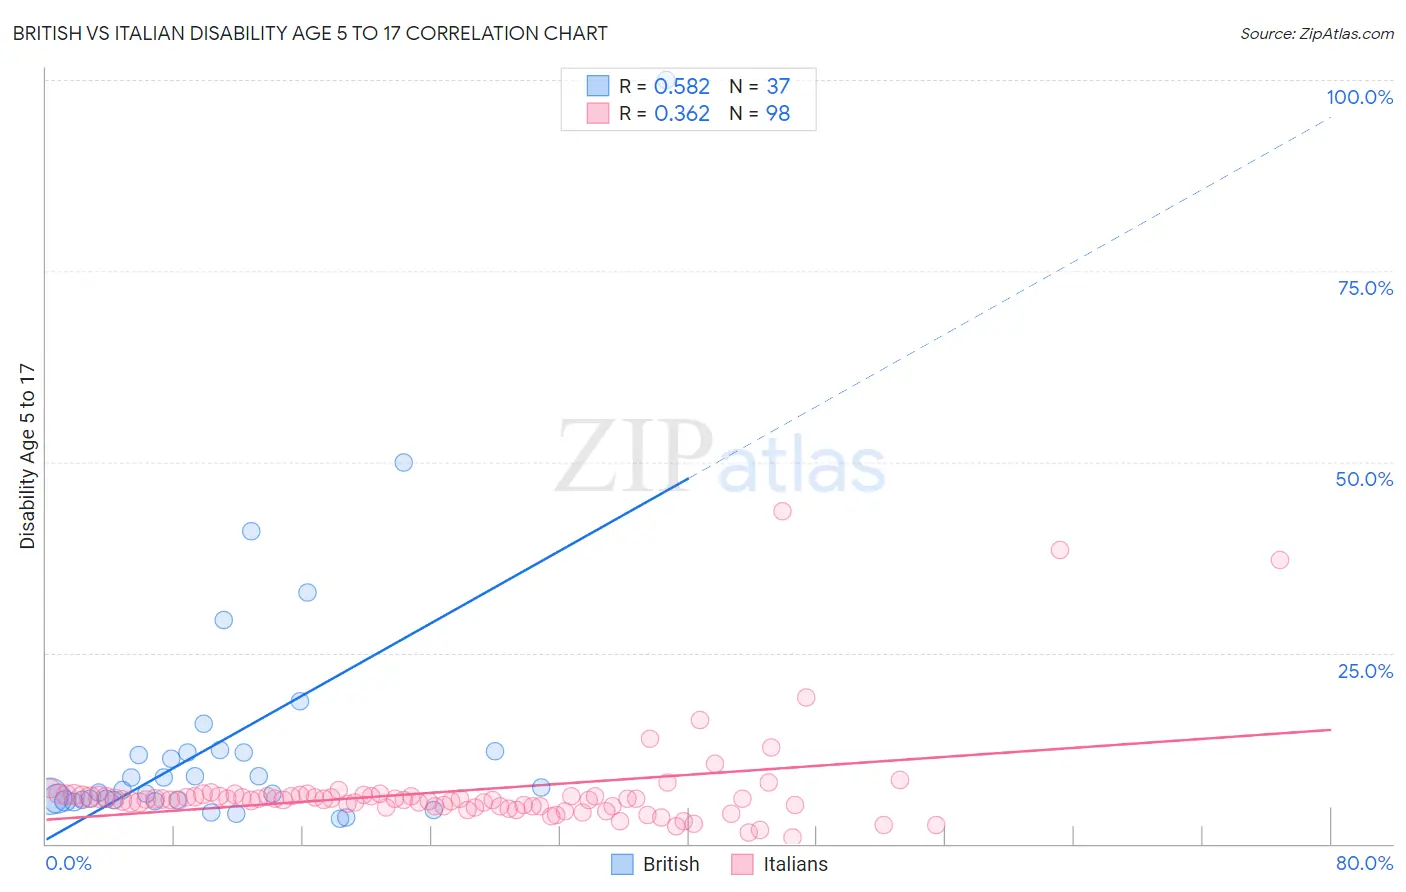
British vs Italian Disability Age 5 to 17 Correlation Chart
The statistical analysis conducted on geographies consisting of 522,278,318 people shows a substantial positive correlation between the proportion of British and percentage of population with a disability between the ages 5 and 17 in the United States with a correlation coefficient (R) of 0.582 and weighted average of 5.9%. Similarly, the statistical analysis conducted on geographies consisting of 560,593,784 people shows a mild positive correlation between the proportion of Italians and percentage of population with a disability between the ages 5 and 17 in the United States with a correlation coefficient (R) of 0.362 and weighted average of 5.9%, a difference of 0.42%.
Disability Age 5 to 17 Correlation Summary
| Measurement | British | Italian |
| Minimum | 3.2% | 0.89% |
| Maximum | 100.0% | 43.5% |
| Range | 96.8% | 42.6% |
| Mean | 13.6% | 6.9% |
| Median | 7.0% | 5.8% |
| Interquartile 25% (IQ1) | 5.7% | 4.9% |
| Interquartile 75% (IQ3) | 12.0% | 6.2% |
| Interquartile Range (IQR) | 6.2% | 1.3% |
| Standard Deviation (Sample) | 18.0% | 6.4% |
| Standard Deviation (Population) | 17.7% | 6.4% |
Demographics Similar to British and Italians by Disability Age 5 to 17
In terms of disability age 5 to 17, the demographic groups most similar to British are Immigrants from Ghana (5.9%, a difference of 0.010%), Immigrants from Honduras (5.9%, a difference of 0.070%), Immigrants from Micronesia (5.9%, a difference of 0.10%), Tlingit-Haida (5.9%, a difference of 0.10%), and Immigrants from Germany (5.9%, a difference of 0.11%). Similarly, the demographic groups most similar to Italians are Barbadian (5.9%, a difference of 0.070%), Scandinavian (5.9%, a difference of 0.17%), Hopi (5.9%, a difference of 0.20%), Honduran (5.9%, a difference of 0.24%), and Immigrants from Cambodia (5.9%, a difference of 0.26%).
| Demographics | Rating | Rank | Disability Age 5 to 17 |
| Immigrants | Caribbean | 2.1 /100 | #241 | Tragic 5.9% |
| Spaniards | 2.0 /100 | #242 | Tragic 5.9% |
| Indonesians | 2.0 /100 | #243 | Tragic 5.9% |
| Immigrants | Germany | 1.9 /100 | #244 | Tragic 5.9% |
| Immigrants | Micronesia | 1.9 /100 | #245 | Tragic 5.9% |
| Tlingit-Haida | 1.9 /100 | #246 | Tragic 5.9% |
| Immigrants | Honduras | 1.8 /100 | #247 | Tragic 5.9% |
| British | 1.7 /100 | #248 | Tragic 5.9% |
| Immigrants | Ghana | 1.7 /100 | #249 | Tragic 5.9% |
| Poles | 1.5 /100 | #250 | Tragic 5.9% |
| Immigrants | Cambodia | 1.5 /100 | #251 | Tragic 5.9% |
| Hondurans | 1.5 /100 | #252 | Tragic 5.9% |
| Scandinavians | 1.4 /100 | #253 | Tragic 5.9% |
| Barbadians | 1.3 /100 | #254 | Tragic 5.9% |
| Italians | 1.2 /100 | #255 | Tragic 5.9% |
| Hopi | 1.0 /100 | #256 | Tragic 5.9% |
| Hispanics or Latinos | 1.0 /100 | #257 | Tragic 5.9% |
| Brazilians | 0.9 /100 | #258 | Tragic 5.9% |
| Slavs | 0.9 /100 | #259 | Tragic 5.9% |
| Somalis | 0.8 /100 | #260 | Tragic 5.9% |
| Immigrants | Middle Africa | 0.7 /100 | #261 | Tragic 5.9% |