Immigrants from West Indies vs Cuban Disability Age 5 to 17
COMPARE
Immigrants from West Indies
Cuban
Disability Age 5 to 17
Disability Age 5 to 17 Comparison
Immigrants from West Indies
Cubans
5.8%
DISABILITY AGE 5 TO 17
3.5/ 100
METRIC RATING
233rd/ 347
METRIC RANK
5.3%
DISABILITY AGE 5 TO 17
97.8/ 100
METRIC RATING
115th/ 347
METRIC RANK
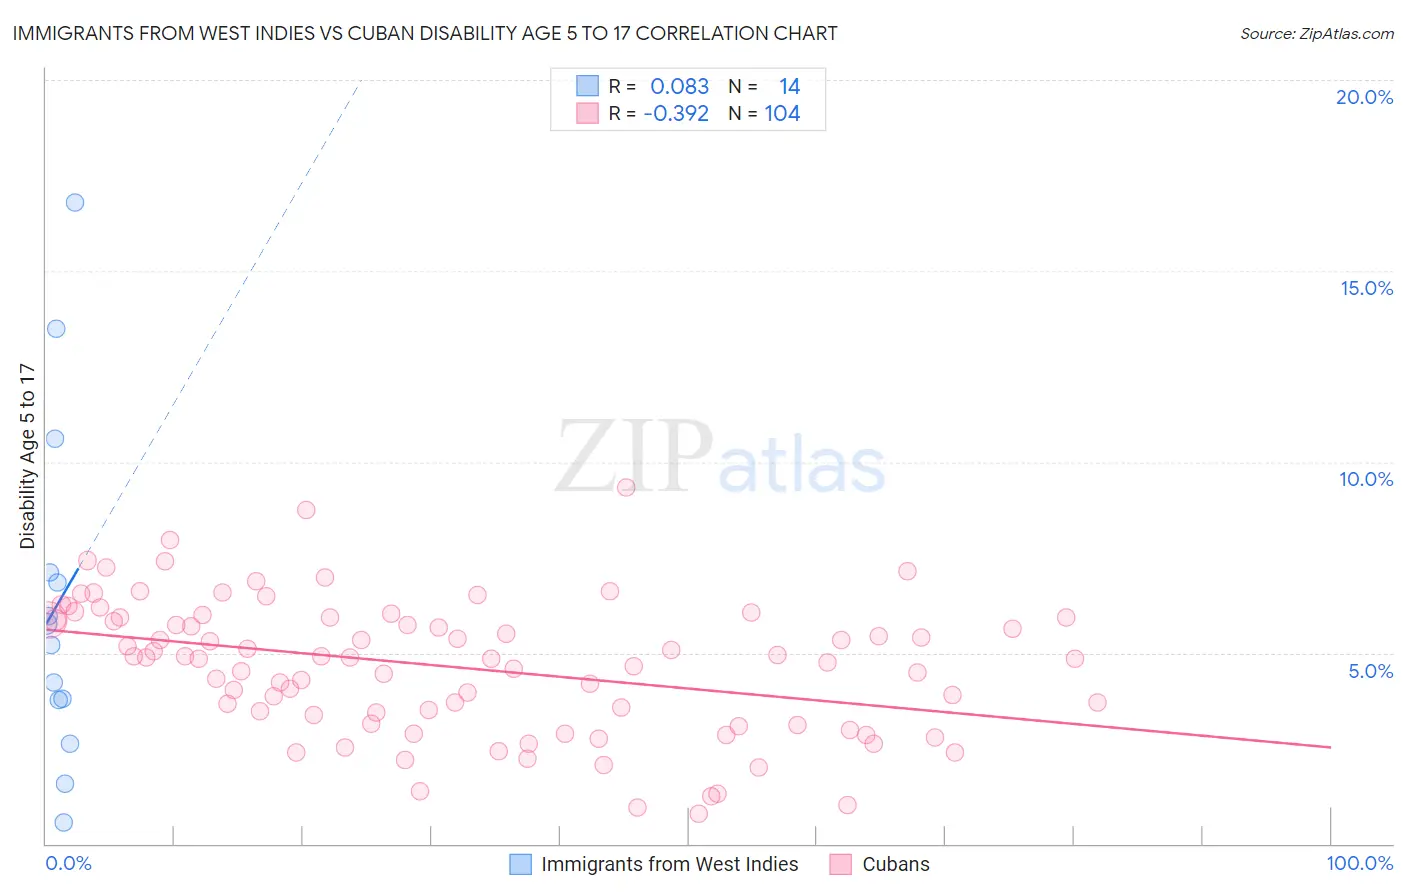
Immigrants from West Indies vs Cuban Disability Age 5 to 17 Correlation Chart
The statistical analysis conducted on geographies consisting of 72,374,754 people shows a slight positive correlation between the proportion of Immigrants from West Indies and percentage of population with a disability between the ages 5 and 17 in the United States with a correlation coefficient (R) of 0.083 and weighted average of 5.8%. Similarly, the statistical analysis conducted on geographies consisting of 444,786,844 people shows a mild negative correlation between the proportion of Cubans and percentage of population with a disability between the ages 5 and 17 in the United States with a correlation coefficient (R) of -0.392 and weighted average of 5.3%, a difference of 9.2%.
Disability Age 5 to 17 Correlation Summary
| Measurement | Immigrants from West Indies | Cuban |
| Minimum | 0.57% | 0.78% |
| Maximum | 16.8% | 9.3% |
| Range | 16.2% | 8.5% |
| Mean | 6.3% | 4.6% |
| Median | 5.5% | 4.9% |
| Interquartile 25% (IQ1) | 3.8% | 3.3% |
| Interquartile 75% (IQ3) | 7.1% | 5.9% |
| Interquartile Range (IQR) | 3.3% | 2.6% |
| Standard Deviation (Sample) | 4.5% | 1.8% |
| Standard Deviation (Population) | 4.4% | 1.8% |
Similar Demographics by Disability Age 5 to 17
Demographics Similar to Immigrants from West Indies by Disability Age 5 to 17
In terms of disability age 5 to 17, the demographic groups most similar to Immigrants from West Indies are Immigrants from Kenya (5.8%, a difference of 0.040%), Malaysian (5.8%, a difference of 0.050%), Immigrants from Laos (5.8%, a difference of 0.090%), Immigrants from Brazil (5.8%, a difference of 0.11%), and Sudanese (5.8%, a difference of 0.26%).
| Demographics | Rating | Rank | Disability Age 5 to 17 |
| British West Indians | 5.4 /100 | #226 | Tragic 5.8% |
| Swiss | 5.1 /100 | #227 | Tragic 5.8% |
| Haitians | 4.8 /100 | #228 | Tragic 5.8% |
| Bangladeshis | 4.8 /100 | #229 | Tragic 5.8% |
| Ghanaians | 4.7 /100 | #230 | Tragic 5.8% |
| Europeans | 4.5 /100 | #231 | Tragic 5.8% |
| Immigrants | Laos | 3.8 /100 | #232 | Tragic 5.8% |
| Immigrants | West Indies | 3.5 /100 | #233 | Tragic 5.8% |
| Immigrants | Kenya | 3.4 /100 | #234 | Tragic 5.8% |
| Malaysians | 3.4 /100 | #235 | Tragic 5.8% |
| Immigrants | Brazil | 3.2 /100 | #236 | Tragic 5.8% |
| Sudanese | 2.9 /100 | #237 | Tragic 5.8% |
| Hungarians | 2.6 /100 | #238 | Tragic 5.8% |
| German Russians | 2.4 /100 | #239 | Tragic 5.9% |
| West Indians | 2.4 /100 | #240 | Tragic 5.9% |
Demographics Similar to Cubans by Disability Age 5 to 17
In terms of disability age 5 to 17, the demographic groups most similar to Cubans are Immigrants from Northern Europe (5.3%, a difference of 0.010%), Aleut (5.3%, a difference of 0.040%), Cypriot (5.3%, a difference of 0.060%), Immigrants from Latvia (5.3%, a difference of 0.080%), and Ethiopian (5.3%, a difference of 0.10%).
| Demographics | Rating | Rank | Disability Age 5 to 17 |
| Immigrants | South Africa | 98.1 /100 | #108 | Exceptional 5.3% |
| Immigrants | Northern Africa | 98.1 /100 | #109 | Exceptional 5.3% |
| Immigrants | Eritrea | 98.0 /100 | #110 | Exceptional 5.3% |
| Ethiopians | 97.9 /100 | #111 | Exceptional 5.3% |
| Immigrants | Latvia | 97.9 /100 | #112 | Exceptional 5.3% |
| Aleuts | 97.8 /100 | #113 | Exceptional 5.3% |
| Immigrants | Northern Europe | 97.8 /100 | #114 | Exceptional 5.3% |
| Cubans | 97.8 /100 | #115 | Exceptional 5.3% |
| Cypriots | 97.7 /100 | #116 | Exceptional 5.3% |
| Immigrants | Afghanistan | 97.4 /100 | #117 | Exceptional 5.3% |
| South Americans | 97.1 /100 | #118 | Exceptional 5.4% |
| Immigrants | South America | 97.1 /100 | #119 | Exceptional 5.4% |
| Immigrants | Immigrants | 97.0 /100 | #120 | Exceptional 5.4% |
| Maltese | 96.0 /100 | #121 | Exceptional 5.4% |
| Chileans | 95.8 /100 | #122 | Exceptional 5.4% |