Hawaiian vs Italian Disability Age 5 to 17
COMPARE
Hawaiian
Italian
Disability Age 5 to 17
Disability Age 5 to 17 Comparison
Hawaiians
Italians
5.5%
DISABILITY AGE 5 TO 17
78.0/ 100
METRIC RATING
156th/ 347
METRIC RANK
5.9%
DISABILITY AGE 5 TO 17
1.2/ 100
METRIC RATING
255th/ 347
METRIC RANK
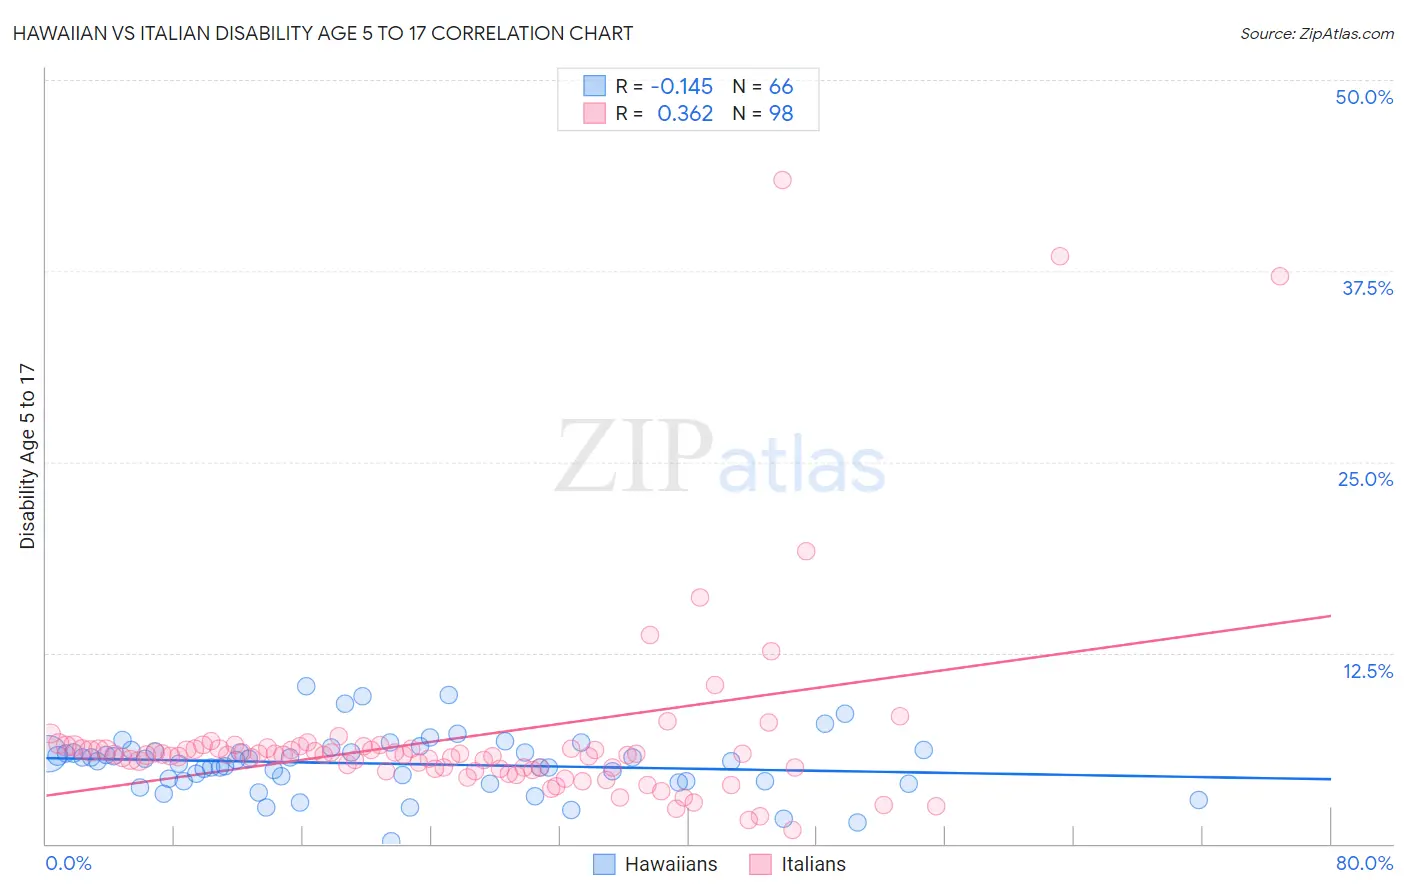
Hawaiian vs Italian Disability Age 5 to 17 Correlation Chart
The statistical analysis conducted on geographies consisting of 325,545,332 people shows a poor negative correlation between the proportion of Hawaiians and percentage of population with a disability between the ages 5 and 17 in the United States with a correlation coefficient (R) of -0.145 and weighted average of 5.5%. Similarly, the statistical analysis conducted on geographies consisting of 560,593,784 people shows a mild positive correlation between the proportion of Italians and percentage of population with a disability between the ages 5 and 17 in the United States with a correlation coefficient (R) of 0.362 and weighted average of 5.9%, a difference of 7.1%.
Disability Age 5 to 17 Correlation Summary
| Measurement | Hawaiian | Italian |
| Minimum | 0.15% | 0.89% |
| Maximum | 10.3% | 43.5% |
| Range | 10.2% | 42.6% |
| Mean | 5.2% | 6.9% |
| Median | 5.5% | 5.8% |
| Interquartile 25% (IQ1) | 4.1% | 4.9% |
| Interquartile 75% (IQ3) | 6.0% | 6.2% |
| Interquartile Range (IQR) | 1.9% | 1.3% |
| Standard Deviation (Sample) | 1.9% | 6.4% |
| Standard Deviation (Population) | 1.9% | 6.4% |
Similar Demographics by Disability Age 5 to 17
Demographics Similar to Hawaiians by Disability Age 5 to 17
In terms of disability age 5 to 17, the demographic groups most similar to Hawaiians are Immigrants from Costa Rica (5.5%, a difference of 0.010%), Immigrants from Ecuador (5.5%, a difference of 0.020%), Australian (5.5%, a difference of 0.060%), Immigrants from Nepal (5.5%, a difference of 0.060%), and Ecuadorian (5.5%, a difference of 0.13%).
| Demographics | Rating | Rank | Disability Age 5 to 17 |
| Central Americans | 81.6 /100 | #149 | Excellent 5.5% |
| Guatemalans | 81.5 /100 | #150 | Excellent 5.5% |
| Estonians | 80.8 /100 | #151 | Excellent 5.5% |
| Ute | 80.6 /100 | #152 | Excellent 5.5% |
| Ecuadorians | 79.7 /100 | #153 | Good 5.5% |
| Australians | 78.8 /100 | #154 | Good 5.5% |
| Immigrants | Ecuador | 78.3 /100 | #155 | Good 5.5% |
| Hawaiians | 78.0 /100 | #156 | Good 5.5% |
| Immigrants | Costa Rica | 77.9 /100 | #157 | Good 5.5% |
| Immigrants | Nepal | 77.1 /100 | #158 | Good 5.5% |
| Immigrants | Zimbabwe | 75.3 /100 | #159 | Good 5.5% |
| South Africans | 73.3 /100 | #160 | Good 5.5% |
| Immigrants | Saudi Arabia | 69.1 /100 | #161 | Good 5.5% |
| Zimbabweans | 67.2 /100 | #162 | Good 5.5% |
| Immigrants | Southern Europe | 64.0 /100 | #163 | Good 5.6% |
Demographics Similar to Italians by Disability Age 5 to 17
In terms of disability age 5 to 17, the demographic groups most similar to Italians are Barbadian (5.9%, a difference of 0.070%), Scandinavian (5.9%, a difference of 0.17%), Hopi (5.9%, a difference of 0.20%), Honduran (5.9%, a difference of 0.24%), and Immigrants from Cambodia (5.9%, a difference of 0.26%).
| Demographics | Rating | Rank | Disability Age 5 to 17 |
| British | 1.7 /100 | #248 | Tragic 5.9% |
| Immigrants | Ghana | 1.7 /100 | #249 | Tragic 5.9% |
| Poles | 1.5 /100 | #250 | Tragic 5.9% |
| Immigrants | Cambodia | 1.5 /100 | #251 | Tragic 5.9% |
| Hondurans | 1.5 /100 | #252 | Tragic 5.9% |
| Scandinavians | 1.4 /100 | #253 | Tragic 5.9% |
| Barbadians | 1.3 /100 | #254 | Tragic 5.9% |
| Italians | 1.2 /100 | #255 | Tragic 5.9% |
| Hopi | 1.0 /100 | #256 | Tragic 5.9% |
| Hispanics or Latinos | 1.0 /100 | #257 | Tragic 5.9% |
| Brazilians | 0.9 /100 | #258 | Tragic 5.9% |
| Slavs | 0.9 /100 | #259 | Tragic 5.9% |
| Somalis | 0.8 /100 | #260 | Tragic 5.9% |
| Immigrants | Middle Africa | 0.7 /100 | #261 | Tragic 5.9% |
| Immigrants | Western Africa | 0.7 /100 | #262 | Tragic 5.9% |