Immigrants from West Indies vs Italian Unemployment Among Ages 20 to 24 years
COMPARE
Immigrants from West Indies
Italian
Unemployment Among Ages 20 to 24 years
Unemployment Among Ages 20 to 24 years Comparison
Immigrants from West Indies
Italians
12.3%
UNEMPLOYMENT AMONG AGES 20 TO 24 YEARS
0.0/ 100
METRIC RATING
304th/ 347
METRIC RANK
10.3%
UNEMPLOYMENT AMONG AGES 20 TO 24 YEARS
57.7/ 100
METRIC RATING
166th/ 347
METRIC RANK
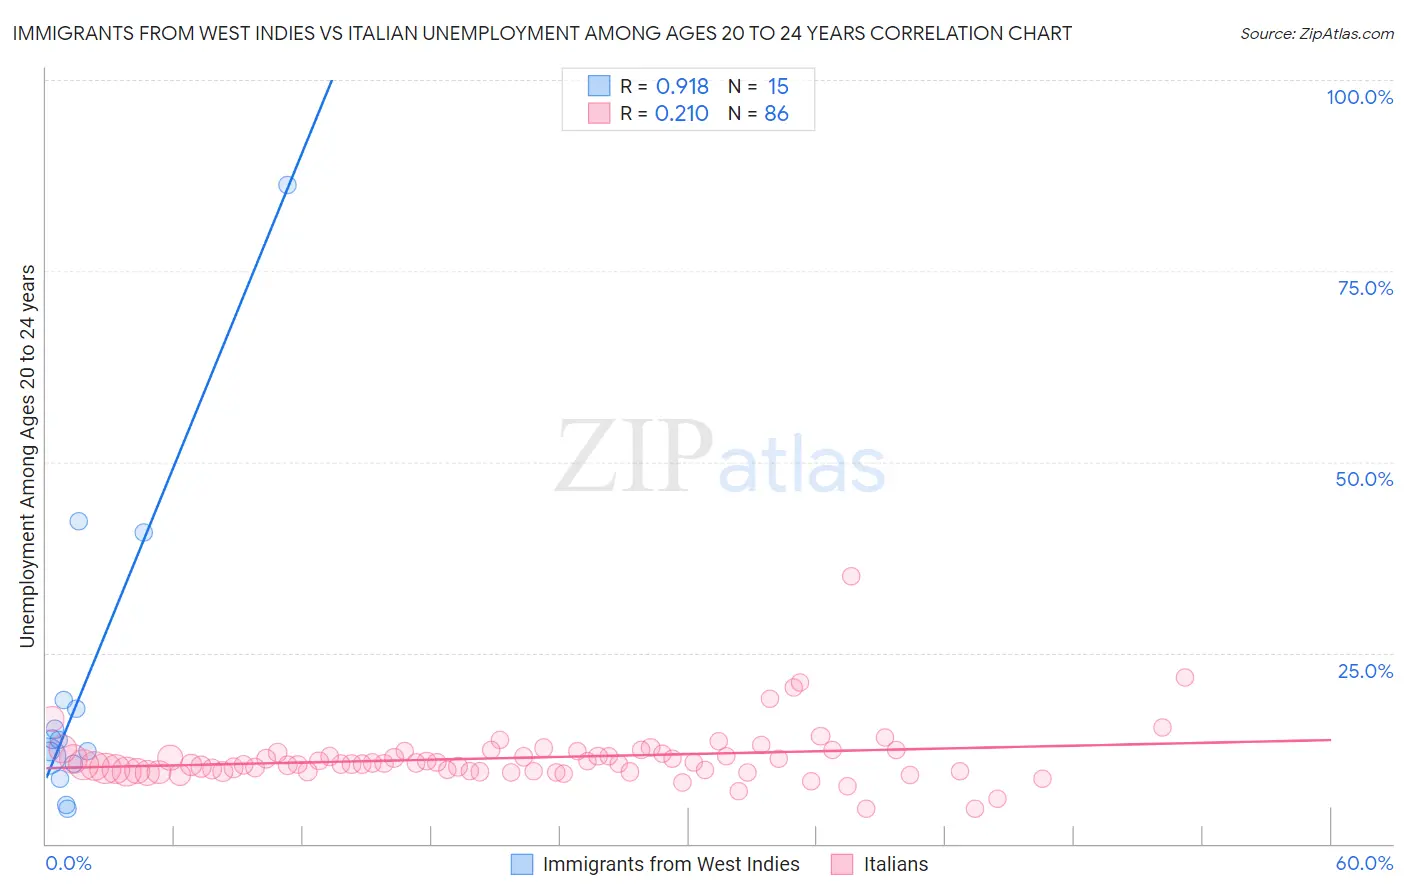
Immigrants from West Indies vs Italian Unemployment Among Ages 20 to 24 years Correlation Chart
The statistical analysis conducted on geographies consisting of 72,183,037 people shows a near-perfect positive correlation between the proportion of Immigrants from West Indies and unemployment rate among population between the ages 20 and 24 in the United States with a correlation coefficient (R) of 0.918 and weighted average of 12.3%. Similarly, the statistical analysis conducted on geographies consisting of 525,991,548 people shows a weak positive correlation between the proportion of Italians and unemployment rate among population between the ages 20 and 24 in the United States with a correlation coefficient (R) of 0.210 and weighted average of 10.3%, a difference of 19.6%.
Unemployment Among Ages 20 to 24 years Correlation Summary
| Measurement | Immigrants from West Indies | Italian |
| Minimum | 4.6% | 4.5% |
| Maximum | 86.2% | 35.1% |
| Range | 81.6% | 30.6% |
| Mean | 20.8% | 11.2% |
| Median | 13.6% | 10.5% |
| Interquartile 25% (IQ1) | 10.5% | 9.5% |
| Interquartile 75% (IQ3) | 18.8% | 12.0% |
| Interquartile Range (IQR) | 8.2% | 2.5% |
| Standard Deviation (Sample) | 21.2% | 3.9% |
| Standard Deviation (Population) | 20.5% | 3.8% |
Similar Demographics by Unemployment Among Ages 20 to 24 years
Demographics Similar to Immigrants from West Indies by Unemployment Among Ages 20 to 24 years
In terms of unemployment among ages 20 to 24 years, the demographic groups most similar to Immigrants from West Indies are Chippewa (12.3%, a difference of 0.040%), Haitian (12.2%, a difference of 0.59%), Immigrants from Cabo Verde (12.2%, a difference of 0.61%), Immigrants from Haiti (12.4%, a difference of 0.88%), and Bermudan (12.5%, a difference of 1.3%).
| Demographics | Rating | Rank | Unemployment Among Ages 20 to 24 years |
| Blackfeet | 0.0 /100 | #297 | Tragic 12.0% |
| Lumbee | 0.0 /100 | #298 | Tragic 12.0% |
| Apache | 0.0 /100 | #299 | Tragic 12.0% |
| Spanish American Indians | 0.0 /100 | #300 | Tragic 12.1% |
| Immigrants | Sierra Leone | 0.0 /100 | #301 | Tragic 12.1% |
| Immigrants | Cabo Verde | 0.0 /100 | #302 | Tragic 12.2% |
| Haitians | 0.0 /100 | #303 | Tragic 12.2% |
| Immigrants | West Indies | 0.0 /100 | #304 | Tragic 12.3% |
| Chippewa | 0.0 /100 | #305 | Tragic 12.3% |
| Immigrants | Haiti | 0.0 /100 | #306 | Tragic 12.4% |
| Bermudans | 0.0 /100 | #307 | Tragic 12.5% |
| Tohono O'odham | 0.0 /100 | #308 | Tragic 12.5% |
| Immigrants | Bangladesh | 0.0 /100 | #309 | Tragic 12.6% |
| Jamaicans | 0.0 /100 | #310 | Tragic 12.6% |
| Vietnamese | 0.0 /100 | #311 | Tragic 12.6% |
Demographics Similar to Italians by Unemployment Among Ages 20 to 24 years
In terms of unemployment among ages 20 to 24 years, the demographic groups most similar to Italians are Immigrants from Fiji (10.3%, a difference of 0.0%), Lebanese (10.3%, a difference of 0.020%), Iraqi (10.3%, a difference of 0.040%), Immigrants from Korea (10.3%, a difference of 0.050%), and Immigrants from Colombia (10.3%, a difference of 0.050%).
| Demographics | Rating | Rank | Unemployment Among Ages 20 to 24 years |
| Immigrants | England | 63.7 /100 | #159 | Good 10.3% |
| Spaniards | 63.4 /100 | #160 | Good 10.3% |
| Indians (Asian) | 62.6 /100 | #161 | Good 10.3% |
| Immigrants | Asia | 61.3 /100 | #162 | Good 10.3% |
| Estonians | 61.1 /100 | #163 | Good 10.3% |
| Immigrants | Korea | 59.0 /100 | #164 | Average 10.3% |
| Lebanese | 58.3 /100 | #165 | Average 10.3% |
| Italians | 57.7 /100 | #166 | Average 10.3% |
| Immigrants | Fiji | 57.6 /100 | #167 | Average 10.3% |
| Iraqis | 56.7 /100 | #168 | Average 10.3% |
| Immigrants | Colombia | 56.3 /100 | #169 | Average 10.3% |
| Turks | 55.2 /100 | #170 | Average 10.3% |
| Immigrants | Eastern Asia | 52.7 /100 | #171 | Average 10.3% |
| Koreans | 51.9 /100 | #172 | Average 10.3% |
| Immigrants | Sweden | 50.8 /100 | #173 | Average 10.3% |