Immigrants from West Indies vs Immigrants from Bangladesh Disability Age 5 to 17
COMPARE
Immigrants from West Indies
Immigrants from Bangladesh
Disability Age 5 to 17
Disability Age 5 to 17 Comparison
Immigrants from West Indies
Immigrants from Bangladesh
5.8%
DISABILITY AGE 5 TO 17
3.5/ 100
METRIC RATING
233rd/ 347
METRIC RANK
5.2%
DISABILITY AGE 5 TO 17
99.8/ 100
METRIC RATING
63rd/ 347
METRIC RANK
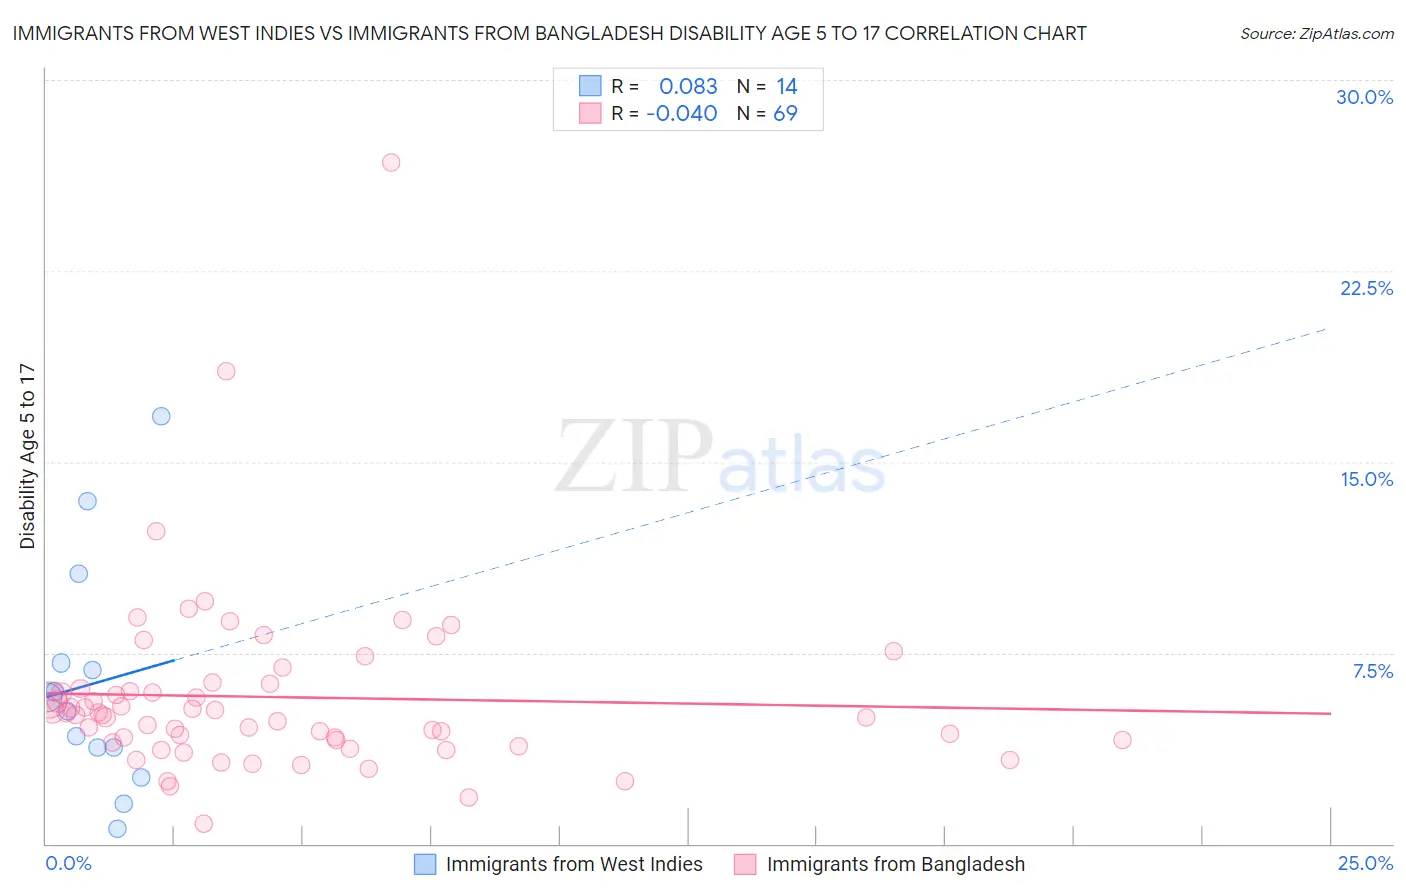
Immigrants from West Indies vs Immigrants from Bangladesh Disability Age 5 to 17 Correlation Chart
The statistical analysis conducted on geographies consisting of 72,374,754 people shows a slight positive correlation between the proportion of Immigrants from West Indies and percentage of population with a disability between the ages 5 and 17 in the United States with a correlation coefficient (R) of 0.083 and weighted average of 5.8%. Similarly, the statistical analysis conducted on geographies consisting of 202,959,719 people shows no correlation between the proportion of Immigrants from Bangladesh and percentage of population with a disability between the ages 5 and 17 in the United States with a correlation coefficient (R) of -0.040 and weighted average of 5.2%, a difference of 12.6%.
Disability Age 5 to 17 Correlation Summary
| Measurement | Immigrants from West Indies | Immigrants from Bangladesh |
| Minimum | 0.57% | 0.80% |
| Maximum | 16.8% | 26.8% |
| Range | 16.2% | 26.0% |
| Mean | 6.3% | 5.8% |
| Median | 5.5% | 5.1% |
| Interquartile 25% (IQ1) | 3.8% | 4.0% |
| Interquartile 75% (IQ3) | 7.1% | 6.2% |
| Interquartile Range (IQR) | 3.3% | 2.2% |
| Standard Deviation (Sample) | 4.5% | 3.7% |
| Standard Deviation (Population) | 4.4% | 3.6% |
Similar Demographics by Disability Age 5 to 17
Demographics Similar to Immigrants from West Indies by Disability Age 5 to 17
In terms of disability age 5 to 17, the demographic groups most similar to Immigrants from West Indies are Immigrants from Kenya (5.8%, a difference of 0.040%), Malaysian (5.8%, a difference of 0.050%), Immigrants from Laos (5.8%, a difference of 0.090%), Immigrants from Brazil (5.8%, a difference of 0.11%), and Sudanese (5.8%, a difference of 0.26%).
| Demographics | Rating | Rank | Disability Age 5 to 17 |
| British West Indians | 5.4 /100 | #226 | Tragic 5.8% |
| Swiss | 5.1 /100 | #227 | Tragic 5.8% |
| Haitians | 4.8 /100 | #228 | Tragic 5.8% |
| Bangladeshis | 4.8 /100 | #229 | Tragic 5.8% |
| Ghanaians | 4.7 /100 | #230 | Tragic 5.8% |
| Europeans | 4.5 /100 | #231 | Tragic 5.8% |
| Immigrants | Laos | 3.8 /100 | #232 | Tragic 5.8% |
| Immigrants | West Indies | 3.5 /100 | #233 | Tragic 5.8% |
| Immigrants | Kenya | 3.4 /100 | #234 | Tragic 5.8% |
| Malaysians | 3.4 /100 | #235 | Tragic 5.8% |
| Immigrants | Brazil | 3.2 /100 | #236 | Tragic 5.8% |
| Sudanese | 2.9 /100 | #237 | Tragic 5.8% |
| Hungarians | 2.6 /100 | #238 | Tragic 5.8% |
| German Russians | 2.4 /100 | #239 | Tragic 5.9% |
| West Indians | 2.4 /100 | #240 | Tragic 5.9% |
Demographics Similar to Immigrants from Bangladesh by Disability Age 5 to 17
In terms of disability age 5 to 17, the demographic groups most similar to Immigrants from Bangladesh are Immigrants from South Eastern Asia (5.2%, a difference of 0.030%), Immigrants from Greece (5.2%, a difference of 0.040%), Palestinian (5.2%, a difference of 0.090%), Immigrants from Ireland (5.2%, a difference of 0.11%), and Macedonian (5.2%, a difference of 0.11%).
| Demographics | Rating | Rank | Disability Age 5 to 17 |
| Immigrants | Turkey | 99.9 /100 | #56 | Exceptional 5.1% |
| Immigrants | Poland | 99.9 /100 | #57 | Exceptional 5.1% |
| Immigrants | Ukraine | 99.9 /100 | #58 | Exceptional 5.1% |
| Immigrants | North Macedonia | 99.9 /100 | #59 | Exceptional 5.1% |
| Immigrants | Eastern Europe | 99.9 /100 | #60 | Exceptional 5.1% |
| Immigrants | Switzerland | 99.8 /100 | #61 | Exceptional 5.2% |
| Immigrants | Ireland | 99.8 /100 | #62 | Exceptional 5.2% |
| Immigrants | Bangladesh | 99.8 /100 | #63 | Exceptional 5.2% |
| Immigrants | South Eastern Asia | 99.8 /100 | #64 | Exceptional 5.2% |
| Immigrants | Greece | 99.8 /100 | #65 | Exceptional 5.2% |
| Palestinians | 99.8 /100 | #66 | Exceptional 5.2% |
| Macedonians | 99.8 /100 | #67 | Exceptional 5.2% |
| Immigrants | Syria | 99.7 /100 | #68 | Exceptional 5.2% |
| Guyanese | 99.7 /100 | #69 | Exceptional 5.2% |
| Immigrants | Belgium | 99.7 /100 | #70 | Exceptional 5.2% |