Immigrants from West Indies vs Chickasaw Disability Age 5 to 17
COMPARE
Immigrants from West Indies
Chickasaw
Disability Age 5 to 17
Disability Age 5 to 17 Comparison
Immigrants from West Indies
Chickasaw
5.8%
DISABILITY AGE 5 TO 17
3.5/ 100
METRIC RATING
233rd/ 347
METRIC RANK
6.8%
DISABILITY AGE 5 TO 17
0.0/ 100
METRIC RATING
336th/ 347
METRIC RANK
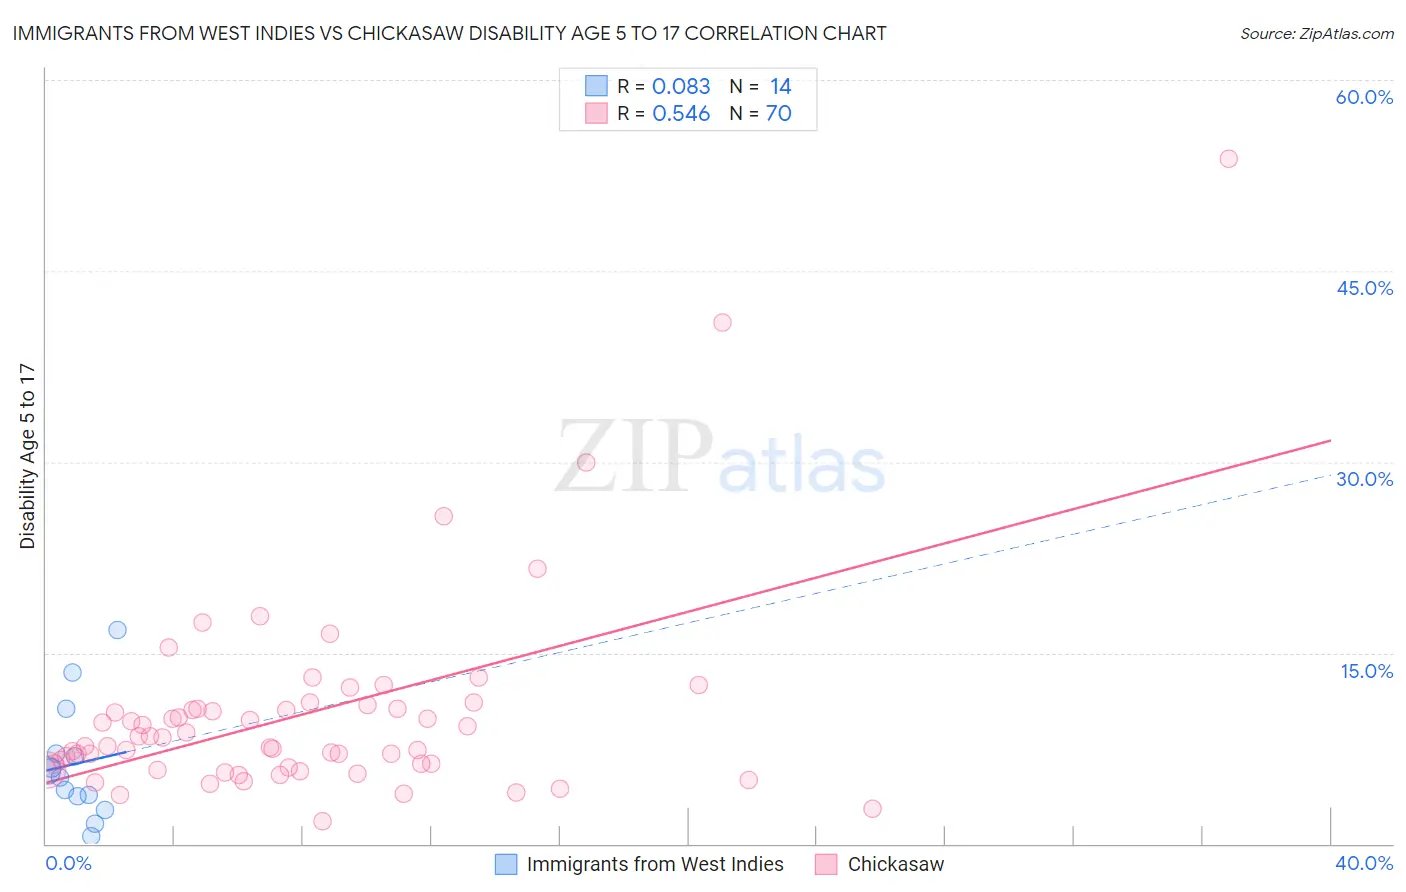
Immigrants from West Indies vs Chickasaw Disability Age 5 to 17 Correlation Chart
The statistical analysis conducted on geographies consisting of 72,374,754 people shows a slight positive correlation between the proportion of Immigrants from West Indies and percentage of population with a disability between the ages 5 and 17 in the United States with a correlation coefficient (R) of 0.083 and weighted average of 5.8%. Similarly, the statistical analysis conducted on geographies consisting of 147,149,878 people shows a substantial positive correlation between the proportion of Chickasaw and percentage of population with a disability between the ages 5 and 17 in the United States with a correlation coefficient (R) of 0.546 and weighted average of 6.8%, a difference of 17.3%.
Disability Age 5 to 17 Correlation Summary
| Measurement | Immigrants from West Indies | Chickasaw |
| Minimum | 0.57% | 1.8% |
| Maximum | 16.8% | 53.8% |
| Range | 16.2% | 52.1% |
| Mean | 6.3% | 10.2% |
| Median | 5.5% | 8.0% |
| Interquartile 25% (IQ1) | 3.8% | 6.0% |
| Interquartile 75% (IQ3) | 7.1% | 10.6% |
| Interquartile Range (IQR) | 3.3% | 4.7% |
| Standard Deviation (Sample) | 4.5% | 8.1% |
| Standard Deviation (Population) | 4.4% | 8.1% |
Similar Demographics by Disability Age 5 to 17
Demographics Similar to Immigrants from West Indies by Disability Age 5 to 17
In terms of disability age 5 to 17, the demographic groups most similar to Immigrants from West Indies are Immigrants from Kenya (5.8%, a difference of 0.040%), Malaysian (5.8%, a difference of 0.050%), Immigrants from Laos (5.8%, a difference of 0.090%), Immigrants from Brazil (5.8%, a difference of 0.11%), and Sudanese (5.8%, a difference of 0.26%).
| Demographics | Rating | Rank | Disability Age 5 to 17 |
| British West Indians | 5.4 /100 | #226 | Tragic 5.8% |
| Swiss | 5.1 /100 | #227 | Tragic 5.8% |
| Haitians | 4.8 /100 | #228 | Tragic 5.8% |
| Bangladeshis | 4.8 /100 | #229 | Tragic 5.8% |
| Ghanaians | 4.7 /100 | #230 | Tragic 5.8% |
| Europeans | 4.5 /100 | #231 | Tragic 5.8% |
| Immigrants | Laos | 3.8 /100 | #232 | Tragic 5.8% |
| Immigrants | West Indies | 3.5 /100 | #233 | Tragic 5.8% |
| Immigrants | Kenya | 3.4 /100 | #234 | Tragic 5.8% |
| Malaysians | 3.4 /100 | #235 | Tragic 5.8% |
| Immigrants | Brazil | 3.2 /100 | #236 | Tragic 5.8% |
| Sudanese | 2.9 /100 | #237 | Tragic 5.8% |
| Hungarians | 2.6 /100 | #238 | Tragic 5.8% |
| German Russians | 2.4 /100 | #239 | Tragic 5.9% |
| West Indians | 2.4 /100 | #240 | Tragic 5.9% |
Demographics Similar to Chickasaw by Disability Age 5 to 17
In terms of disability age 5 to 17, the demographic groups most similar to Chickasaw are Creek (6.9%, a difference of 0.43%), Ottawa (6.8%, a difference of 0.50%), Iroquois (6.9%, a difference of 0.68%), Choctaw (6.9%, a difference of 1.0%), and Seminole (6.8%, a difference of 1.2%).
| Demographics | Rating | Rank | Disability Age 5 to 17 |
| Blackfeet | 0.0 /100 | #329 | Tragic 6.6% |
| Dutch West Indians | 0.0 /100 | #330 | Tragic 6.7% |
| French Canadians | 0.0 /100 | #331 | Tragic 6.7% |
| Immigrants | Azores | 0.0 /100 | #332 | Tragic 6.7% |
| Blacks/African Americans | 0.0 /100 | #333 | Tragic 6.8% |
| Seminole | 0.0 /100 | #334 | Tragic 6.8% |
| Ottawa | 0.0 /100 | #335 | Tragic 6.8% |
| Chickasaw | 0.0 /100 | #336 | Tragic 6.8% |
| Creek | 0.0 /100 | #337 | Tragic 6.9% |
| Iroquois | 0.0 /100 | #338 | Tragic 6.9% |
| Choctaw | 0.0 /100 | #339 | Tragic 6.9% |
| Cherokee | 0.0 /100 | #340 | Tragic 6.9% |
| Cape Verdeans | 0.0 /100 | #341 | Tragic 7.0% |
| Chippewa | 0.0 /100 | #342 | Tragic 7.1% |
| Immigrants | Cabo Verde | 0.0 /100 | #343 | Tragic 7.1% |