Immigrants from Nigeria vs Belgian Currently Married
COMPARE
Immigrants from Nigeria
Belgian
Currently Married
Currently Married Comparison
Immigrants from Nigeria
Belgians
43.4%
CURRENTLY MARRIED
0.1/ 100
METRIC RATING
277th/ 347
METRIC RANK
48.7%
CURRENTLY MARRIED
99.3/ 100
METRIC RATING
45th/ 347
METRIC RANK
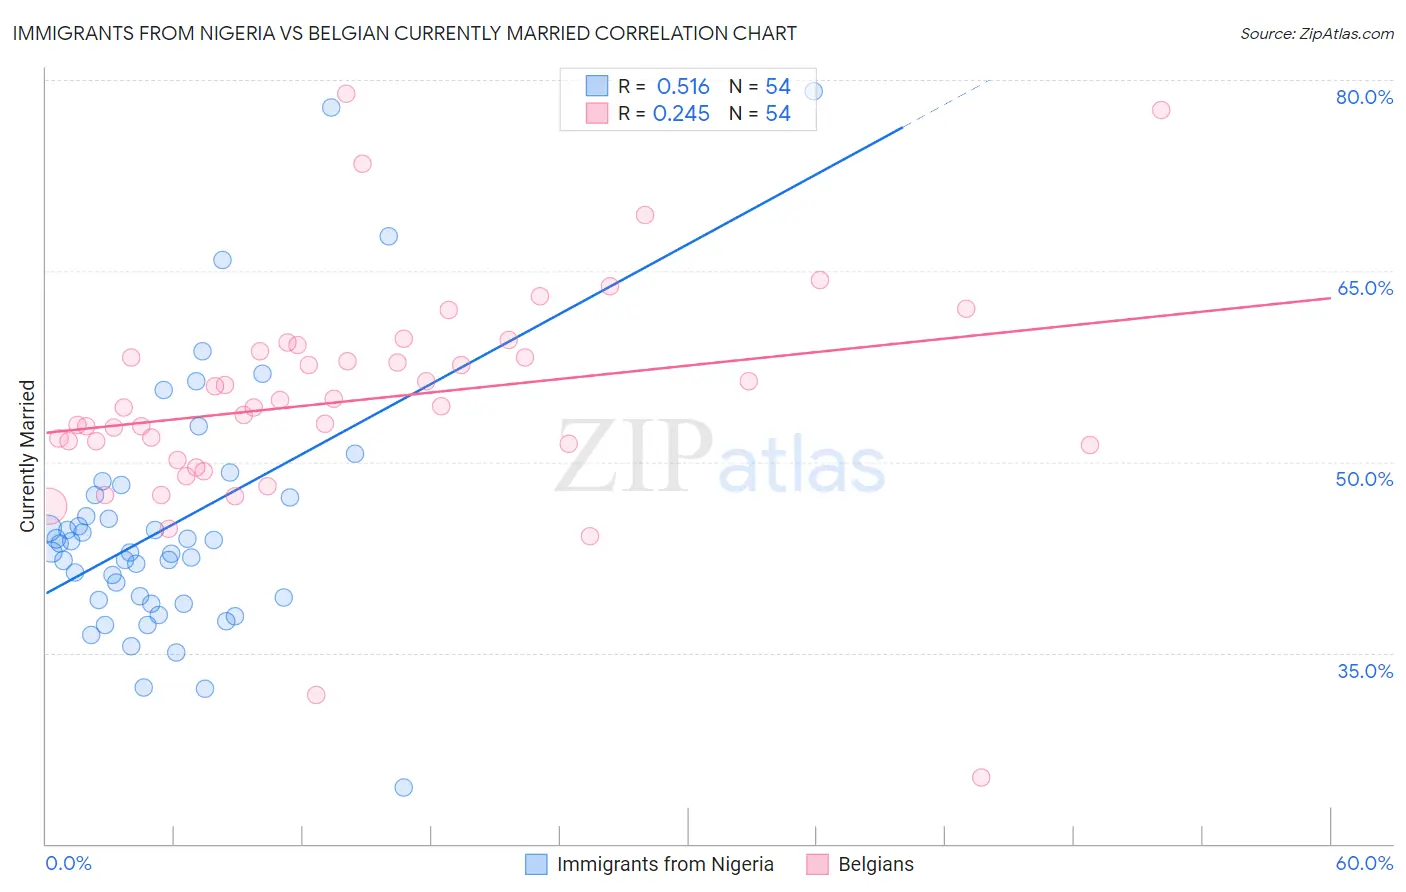
Immigrants from Nigeria vs Belgian Currently Married Correlation Chart
The statistical analysis conducted on geographies consisting of 283,441,157 people shows a substantial positive correlation between the proportion of Immigrants from Nigeria and percentage of population currently married in the United States with a correlation coefficient (R) of 0.516 and weighted average of 43.4%. Similarly, the statistical analysis conducted on geographies consisting of 355,993,488 people shows a weak positive correlation between the proportion of Belgians and percentage of population currently married in the United States with a correlation coefficient (R) of 0.245 and weighted average of 48.7%, a difference of 12.2%.
Currently Married Correlation Summary
| Measurement | Immigrants from Nigeria | Belgian |
| Minimum | 24.4% | 25.2% |
| Maximum | 79.1% | 78.9% |
| Range | 54.7% | 53.7% |
| Mean | 45.1% | 54.9% |
| Median | 43.2% | 54.3% |
| Interquartile 25% (IQ1) | 39.2% | 51.3% |
| Interquartile 75% (IQ3) | 47.4% | 58.7% |
| Interquartile Range (IQR) | 8.3% | 7.4% |
| Standard Deviation (Sample) | 10.2% | 9.0% |
| Standard Deviation (Population) | 10.1% | 8.9% |
Similar Demographics by Currently Married
Demographics Similar to Immigrants from Nigeria by Currently Married
In terms of currently married, the demographic groups most similar to Immigrants from Nigeria are Sierra Leonean (43.4%, a difference of 0.010%), Colville (43.4%, a difference of 0.040%), Nigerian (43.4%, a difference of 0.060%), Yaqui (43.4%, a difference of 0.070%), and Indonesian (43.5%, a difference of 0.12%).
| Demographics | Rating | Rank | Currently Married |
| Salvadorans | 0.1 /100 | #270 | Tragic 43.5% |
| Bermudans | 0.1 /100 | #271 | Tragic 43.5% |
| Indonesians | 0.1 /100 | #272 | Tragic 43.5% |
| Yaqui | 0.1 /100 | #273 | Tragic 43.4% |
| Nigerians | 0.1 /100 | #274 | Tragic 43.4% |
| Colville | 0.1 /100 | #275 | Tragic 43.4% |
| Sierra Leoneans | 0.1 /100 | #276 | Tragic 43.4% |
| Immigrants | Nigeria | 0.1 /100 | #277 | Tragic 43.4% |
| Central Americans | 0.0 /100 | #278 | Tragic 43.3% |
| Central American Indians | 0.0 /100 | #279 | Tragic 43.3% |
| Apache | 0.0 /100 | #280 | Tragic 43.2% |
| Chippewa | 0.0 /100 | #281 | Tragic 43.2% |
| Immigrants | Ecuador | 0.0 /100 | #282 | Tragic 43.2% |
| Kiowa | 0.0 /100 | #283 | Tragic 43.2% |
| Immigrants | El Salvador | 0.0 /100 | #284 | Tragic 43.1% |
Demographics Similar to Belgians by Currently Married
In terms of currently married, the demographic groups most similar to Belgians are Immigrants from North America (48.7%, a difference of 0.030%), Immigrants from Iran (48.7%, a difference of 0.030%), Northern European (48.7%, a difference of 0.040%), Austrian (48.7%, a difference of 0.050%), and Finnish (48.8%, a difference of 0.060%).
| Demographics | Rating | Rank | Currently Married |
| Czechoslovakians | 99.4 /100 | #38 | Exceptional 48.8% |
| British | 99.4 /100 | #39 | Exceptional 48.8% |
| Immigrants | Canada | 99.4 /100 | #40 | Exceptional 48.8% |
| Greeks | 99.3 /100 | #41 | Exceptional 48.8% |
| Finns | 99.3 /100 | #42 | Exceptional 48.8% |
| Scotch-Irish | 99.3 /100 | #43 | Exceptional 48.7% |
| Immigrants | North America | 99.3 /100 | #44 | Exceptional 48.7% |
| Belgians | 99.3 /100 | #45 | Exceptional 48.7% |
| Immigrants | Iran | 99.2 /100 | #46 | Exceptional 48.7% |
| Northern Europeans | 99.2 /100 | #47 | Exceptional 48.7% |
| Austrians | 99.2 /100 | #48 | Exceptional 48.7% |
| Bhutanese | 99.1 /100 | #49 | Exceptional 48.6% |
| Iranians | 99.0 /100 | #50 | Exceptional 48.6% |
| Whites/Caucasians | 99.0 /100 | #51 | Exceptional 48.6% |
| Russians | 98.9 /100 | #52 | Exceptional 48.6% |